Question
Question: How do you sketch the graph of \[\dfrac{1}{{{x}^{2}}-4}\]?...
How do you sketch the graph of x2−41?
Solution
First of all draw the graph of the rectangular hyperbola y=x21 and check its different properties. Similarly, consider the given hyperbola y=x2−41 and draw its graph for the values of x greater than 0. Check the nature of the equation for 0≤x<2 and x > 2 partwise to draw the graph. Once the graph is drawn for positive values of x, take its mirror image in the y – axis to draw the whole graph.
Complete step-by-step solution:
Here, we have been provided with the equation y=x2−41 and we are asked to draw its graph. As, we can see that this equation represents a rectangular hyperbola, so let us first draw the graph of the hyperbola y=x21 and check its properties.
Now, the graph of the hyperbola y=x21 is shown as: -
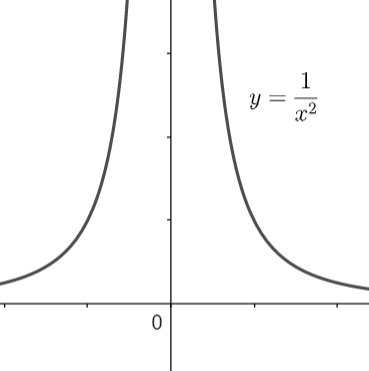
From the graph we can see that as x is tending to 0, y is tending to infinity and as x is tending to infinity, y is trending to 0. Also, we can see that the curves are mirror images of each other in the y – axis. The reason is that y=x21 is an even function, i.e., f (x) = f (-x).
Now, let us come to the question. We have the hyperbola y=x2−41.
As we can see that this function is also an even function, so if we will be able to draw its graph for the positive values of x then we will take the mirror image to get the whole graph. For the hyperbola y=x2−41 we can say that as x will tend to 2, y will tend to infinity, but we don’t know either from positive side or negative side. So, let us break the values of x into two parts and check them one – by – one.
(i) When 0≤x<2.
In this case x2−4 will be negative. Now, as we will keep on increasing the value of x up to 2, the value of x2−4 will keep on decreasing and therefore x2−41 will keep in increasing but towards the negative side. So, in this case as x tends to 2, y tends to −∞.
(ii) When x > 2.
In this case x2−4 will be positive. Now, as we will keep in increasing the value of x, the value of x2−4 will keep in increasing and therefore x2−41 will keep on decreasing. Now, consider any value of x very close to 2, in this case x2−4 will be very close to 0 and therefore x2−41 will be very close to infinity but this time from the positive side.
Now, considering the above two cases and drawing the graph, we get,
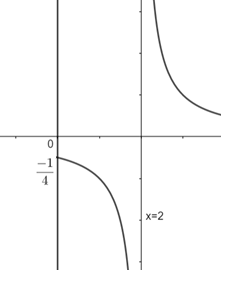
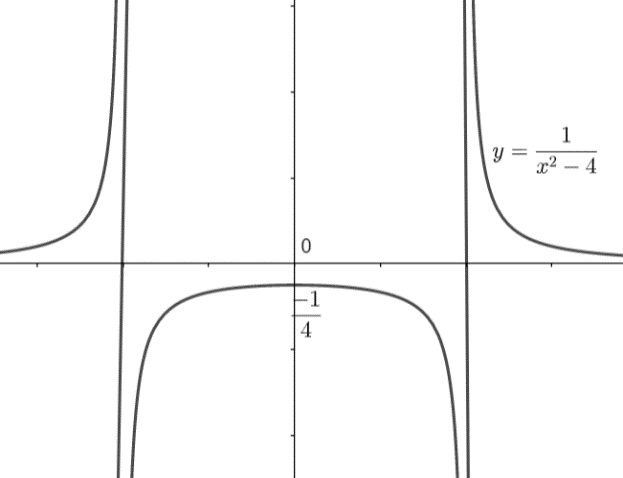
Now, we have to take its mirror image in y – axis to get the whole graph because if we will consider the corresponding negative values of x, the value of x2−4 is not going to change and therefore the values of y will remain the same. So, the whole graph of this function will be given as: -
Note: One must remember the two types of functions, i.e., odd function and eve function. Odd functions are defined as f (x) = f (-x) and even functions are defined as f (x) = -f (-x). Remember that an even function is the mirror image of the curve in the y – axis while odd function is the mirror image of the curve in the line y = x. You must remember the basic graphs of the rectangular hyperbolas y=xn1 for n = even and n = odd integers. Sometimes ‘n’ will be a fraction, in such cases we have to check the domain values.