Question
Question: How do you sketch the graph \[f\left( x \right) = {e^x} + 1\]?...
How do you sketch the graph f(x)=ex+1?
Solution
In this question we have an exponential function and want to draw a graph by using this function.
We can simply put the value of x like −2,−1,0,1,2.......etc then we find the value of f(x) which is lie on y axis. By using these points, we can draw the graph.
Complete step by step answer:
In this question, we use the word exponential function. First we know about exponential function. Exponential function is defined as the function in which an independent variable comes in one exponent. The exponential function is denoted as below.
⇒y=ex
It is also expressed as below type.
y=exp(x)
The above function is also called a natural exponential function.
We know that y=ex is a one to one function and we also know that its inverse will also be a function. Then we find the inverse function of y=ex function. The inverse function of y=ex is given as below.
⇒y=logex
It is also written as the below type.
y=lnx
Now we come to the question, in the question an exponential function is given. The function is given below.
⇒f(x)=ex+1
To draw a graph, first we find the points.
We put the value of x=0 in the above function to find the point.
Then,
⇒f(x)=e0+1
We know that e0=1, and then put this value in the above function.
⇒f(x)=1+1=2
Then the point is(0,2).
Now, we put the value of x=1 in f(x)=ex+1 to find the point.
Then,
⇒f(x)=e1+1
We know that e1=2.718, and then put this value in the above function.
⇒f(x)=2.718+1=3.718
Then the point is (1,3.718).
Now, we put the value of x=−1 in f(x)=ex+1 to find the point.
Then,
⇒f(x)=e−1+1
We know thate−1=0.368, and then put this value in the above function.
⇒f(x)=0.368+1=1.368
Then the point is(−1,1.368).
Therefore, the points are (0,2) ,(1,3.718)and(−1,1.368).
Then we can draw the graph as:
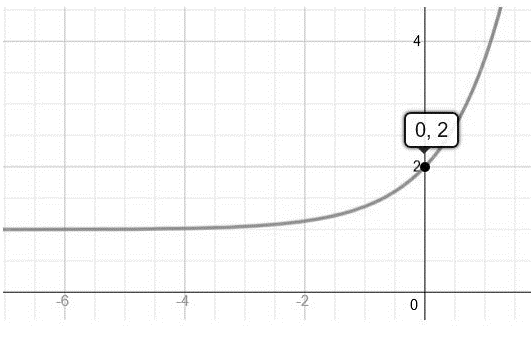
Note:
As we can conclude from the graph that for the positive value ofx, the exponential function f(x)=ex+1 is approaches to ∞ exponentially. And for the negative value ofx, the exponential function f(x)=ex+1 approaches the value 1.