Question
Question: How do you sketch one cycle of \[y = - \cot (x)?\]...
How do you sketch one cycle of y=−cot(x)?
Solution
Hint : In the given question we have to find the graph of the given function y=−cot(x) . Now first of all you should know how to plot the graph of cot(x) . Now once you plot the graph of cot(x) you just have to make a mirror image of it. Now in the question you have been asked to find only one cycle so just plot the one cycle of cot(x) and make a mirror image of it you will get the graph of y=−cot(x) .
Complete step-by-step answer :
In the given question we have to plot one cycle of y=−cot(x) i.e.
y=−cot(x)=−sinxcosx,
x is not equal to ( asymptotic ) zeroes of the denominator so,
kπ,k=0,±1,±2,±3,....
Now here period is equal to period of reciprocal (−tanx)=π .
So the space between consecutive asymptotes will be ,x=kπ .
And the amplitude will be 21π
Now the graph will be,
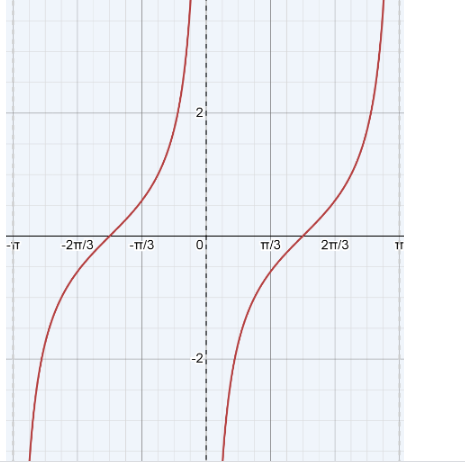
Here the horizontal line represents the x axis and the vertical line represents the y axis. now we will see how the graph was plotted,
x=−arctan(y1),x∈[−2π,2π],
Graph x+arctan(y1)=0
This phenomenon is attributed to the constraint on the range of arctan values as
[−2π,2π] .
Note : Here if you don’t know the meaning of words like asymptotic, amplitude, arctan, period so first of all you should learn all the basic terms of trigonometry as well as of functions graph. Also you should know the graph of basic functions of trigonometry because if you would have known the graph of cot(x) you would have easily plotted the graph of y=−cot(x) so lean all the graphs of basic trigonometry functions.