Question
Question: How do you show that \(f(x) = 2x\;{\text{and}}\;g(x) = \dfrac{x}{2}\) are inverse functions algebrai...
How do you show that f(x)=2xandg(x)=2x are inverse functions algebraically and graphically?
Solution
To proof algebraically use composite function and show output of fog(x)=gof(x) equals input that is x. And to proof it graphically, plot graphs of both the lines and show that they are symmetric about the line x=y
Complete step by step solution:
Proving that f(x)=2xandg(x)=2x are inverse functions algebraically:
To show f(x)=2xandg(x)=2x are inverse function algebraically, we will first find the composite function fog(x)andgof(x)
Composite function fog(x) will be written in the way that we will take function g(x) as the argument of the function f(x) as follows
Now similarly finding gof(x), we will get
gof(x)=2f(x) =22x =x
So we can see that the composite functions are giving the output equals input that is fog(x)=gof(x)=x
Therefore we can say that f(x)andg(x) are inverse functions.
Again proving their inverse nature towards each other graphically,
We will plot the graph of f(x)=2xandg(x)=2x and then see if they will be symmetric about the line x=y or not. And if they will be symmetric then they are inverse function to each other.
Now to plot the graph we will rewrite the equations as
y=2xandy=2x
We will first find some points of both the equations, to plot their graph, so collecting points as follows
| x | y=2x | y=2x | Coordinates for graph of first equation | Coordinates for graph of second equation |
|---|---|---|---|---|
| 0 | 0 | 0 | (0,0) | (0,0) |
| 2 | 4 | 1 | (2,4) | (2,1) |
So we get (0,0)and(2,4) as points of graph for first equation and (0,0)and(2,1) as points of graph for second equation. So plotting their graph:
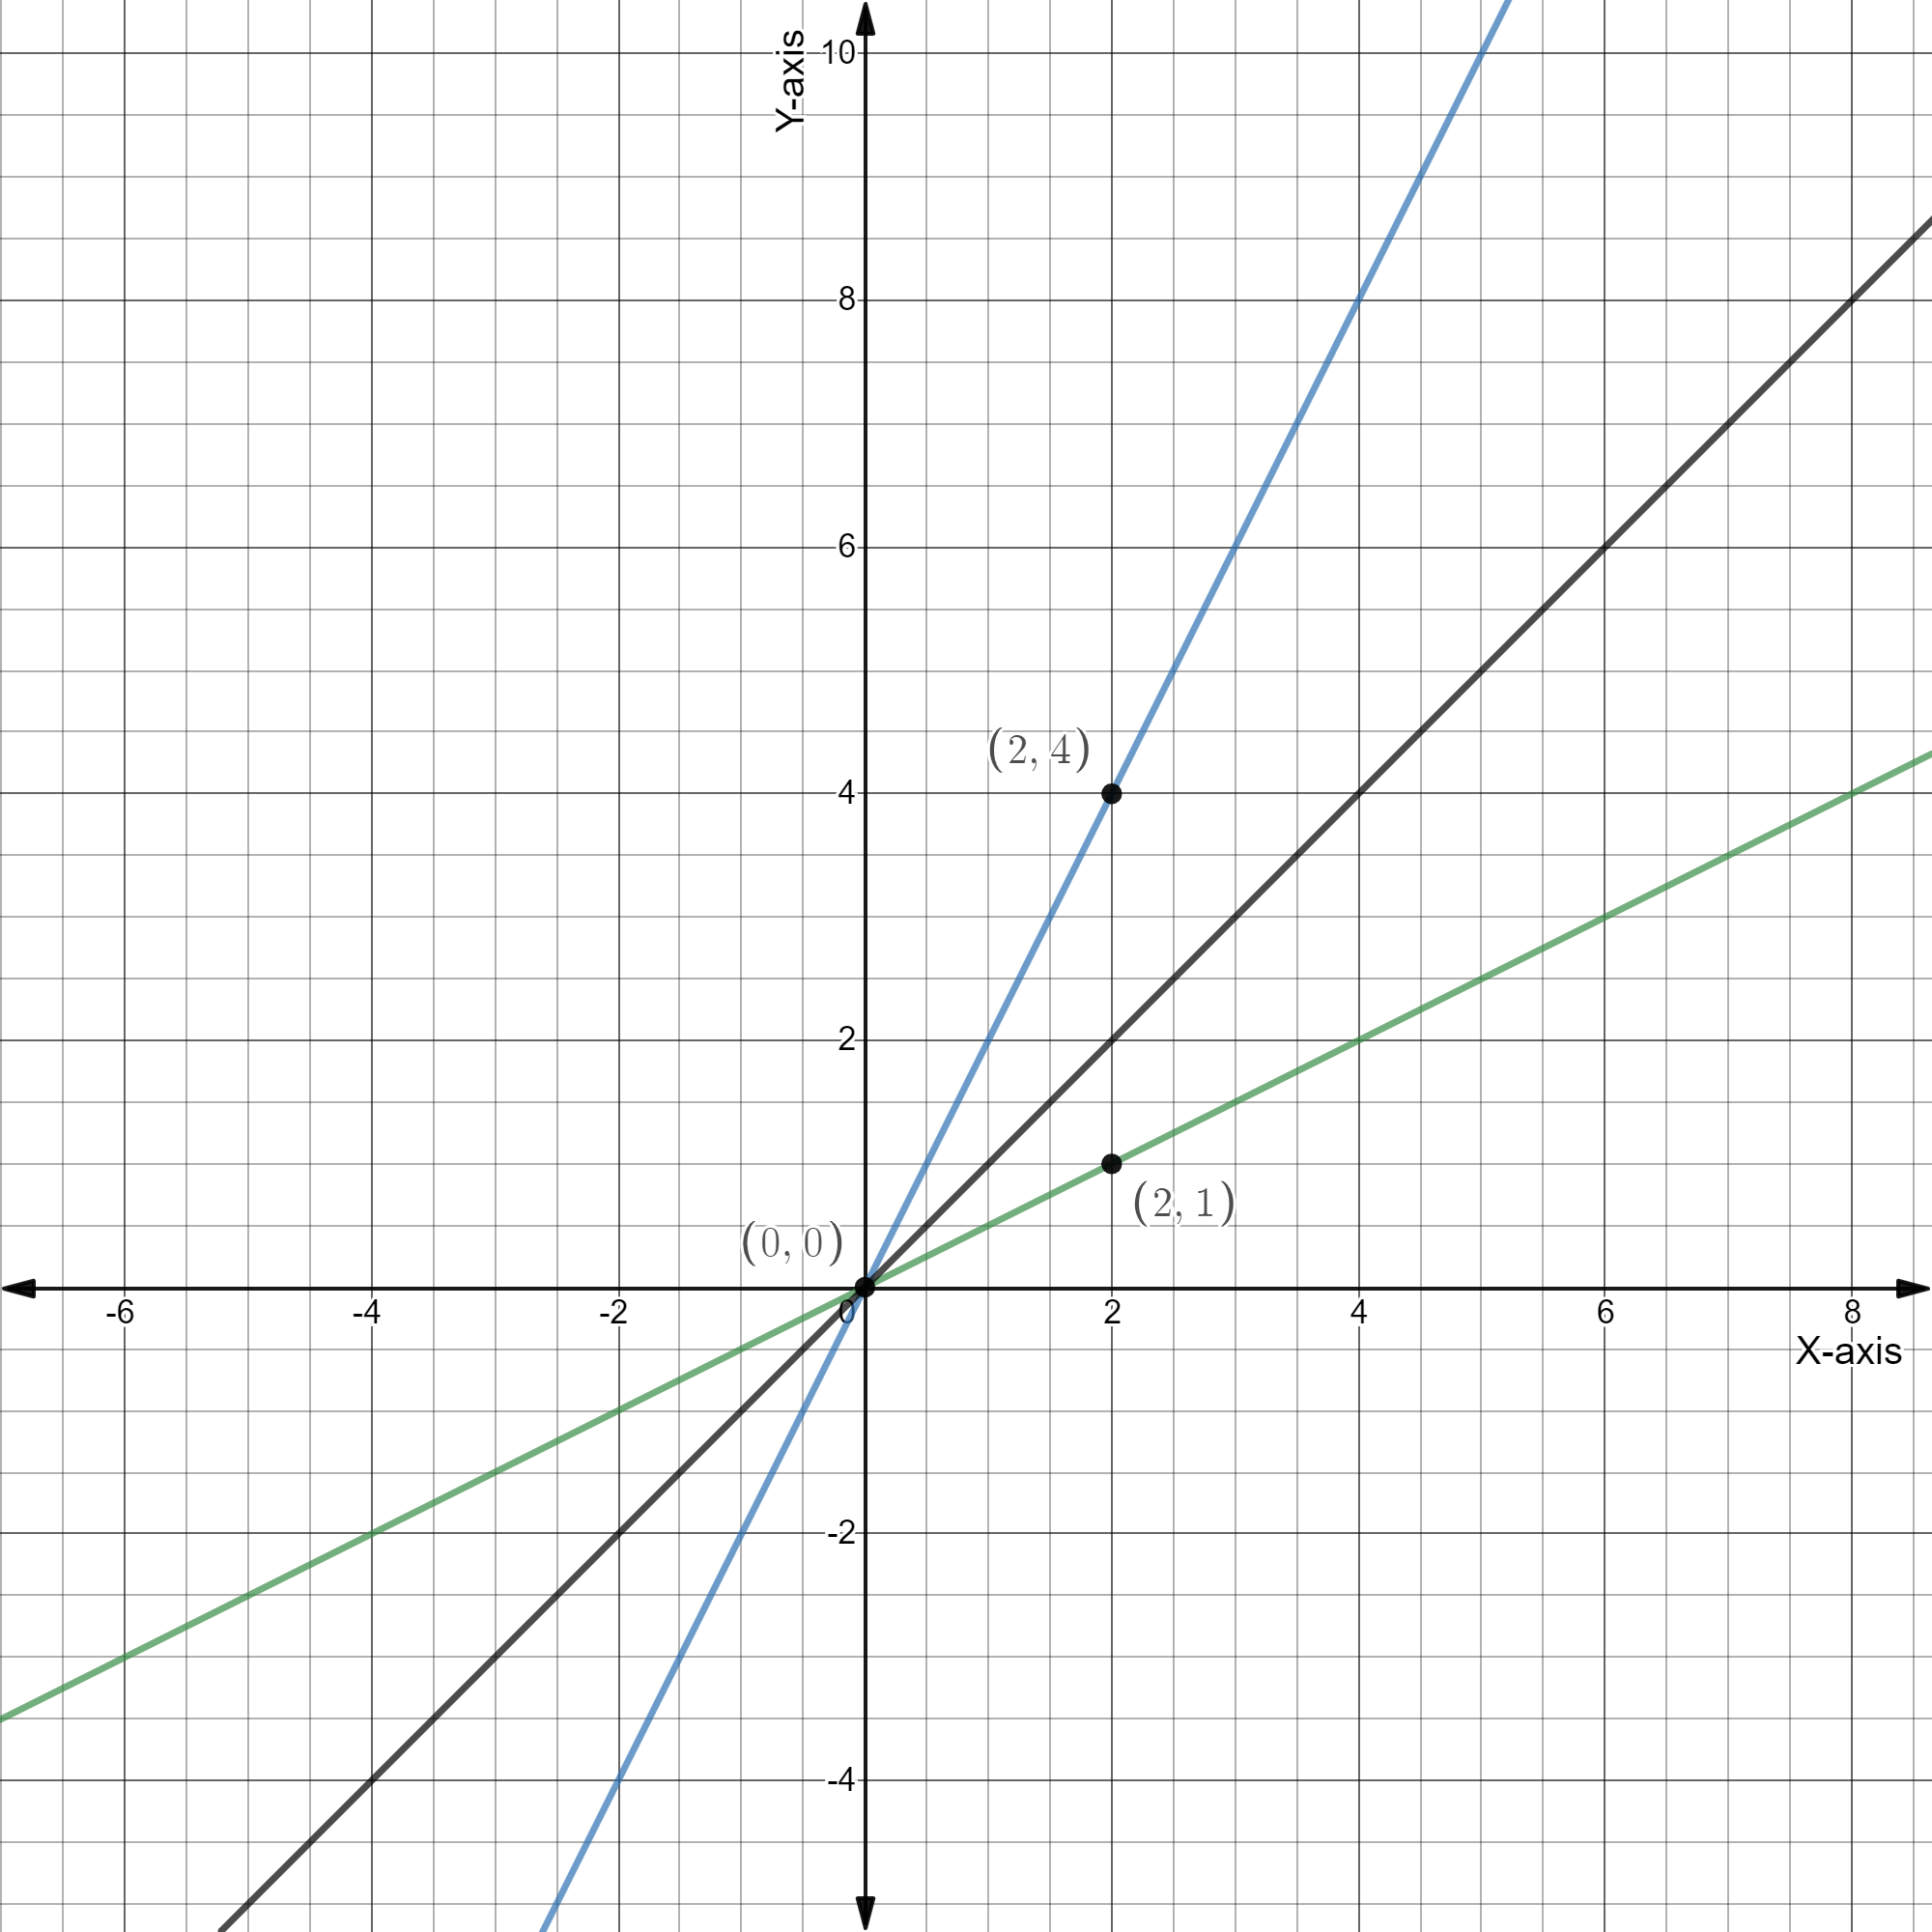
Blue line represents f(x)=2x
Green line represents g(x)=2x
And black line represents x=y
So we can clearly see that the green and blue lines are symmetric about black line. Hence proved
Note: Find such points to graph the equations that are firstly should be at reasonable distance from each other and also should have the whole number value (so that you can plot them easily). Also take the scale of the graph according to the points.