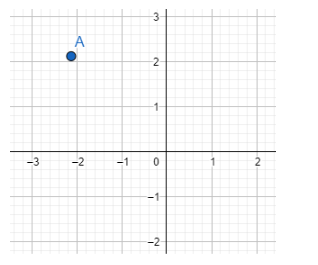
Question
Question: How do you plot the polar coordinates \( \left( -3,\dfrac{3\pi }{4} \right) \) ?...
How do you plot the polar coordinates (−3,43π) ?
Solution
Hint : We explain the number of ways position of a point or equation can be expressed in different forms. We also explain the ways the representation works for polar and cartesian form. Then we convert the given polar form of the point into cartesian form using the relations x=rcosθ;y=rsinθ for the given point (r,θ)=(−3,43π) .
Complete step-by-step answer :
There are always two ways to represent any point equation in our general 2-D and 3-D surfaces. One being the polar form and other one being the cartesian form. The other name of the cartesian form is rectangular form.
In case of polar form, we use the distance and the angle from the origin to get the position of the point or curve.
The given point (−3,43π) is a representation of the polar form. r represents the distance and θ represents the angle.
In case of rectangular form, we use the coordinates from the origin to get the position of the point or curve. For two dimensional things we have X-Y and for three dimensional things we have X-Y-Z. We take the perpendicular distances from the axes.
We need to convert the given point (−3,43π) into the rectangular form.
The relation between these two forms in two-dimensional is
x=rcosθ;y=rsinθ;x2+y2=r2 .
So, putting the values we get x=∣(−3)∣cos(43π);y=∣(−3)∣sin(43π) .
Simplifying we get x=2−3;y=23 .

So, the correct answer is “ x=2−3;y=23 ”.
Note : In case of points for cartesian form we use x and y coordinates as (x,y) to express their position in the cartesian plane. The distance from origin is r=x2+y2 . This r represents the distance in polar form.
