Question
Question: How do you plot the points (4,1),(-2,3),(3,0) on the coordinate plane?...
How do you plot the points (4,1),(-2,3),(3,0) on the coordinate plane?
Solution
Plot a table first and make two columns and 5 rows. Now for every value of x starting from -2, try to get the value of y. After getting all the points, tabulate them and then graph each point on the graph. After doing this, connect all the lines to get the graph you need.
Complete step by step solution:
In order to draw the graph of the given values the first thing we will need to do is draw a table where we will note down respective values of x and y given to us
| x | Y |
|---|---|
| 4 | 1 |
| -2 | 3 |
| 3 | 0 |
Now we will point each point on the graph
Scale of our graph is horizontal line = X axis. Vertical line=Y axis. And 1 block is of 0.5 unit x axis and 0.5 unit on y axis.
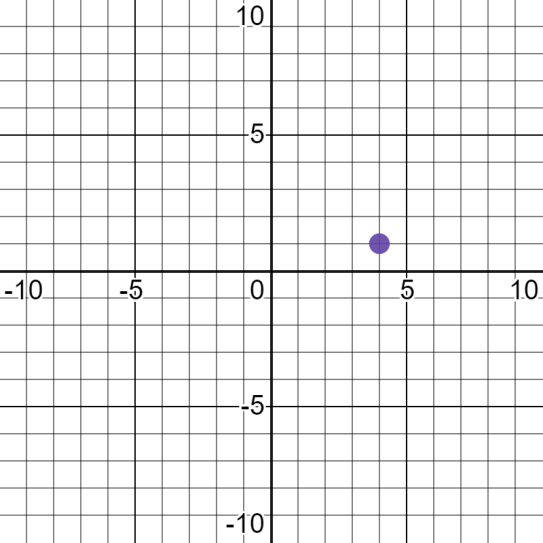
So let’s start with the first one where
x=4 and y=1
This means the point will be 4 points away from y axis and 1 units away from x axis
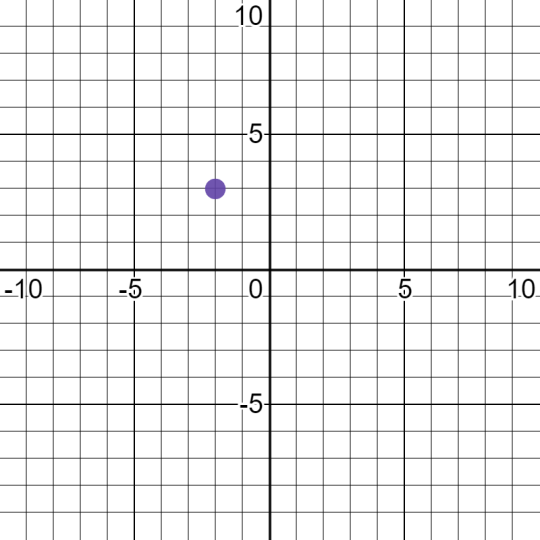
Now, we will graph the second point
Where x=-2 and y=3
This means the point will be -2 points away from y axis and 3 units away from x axis
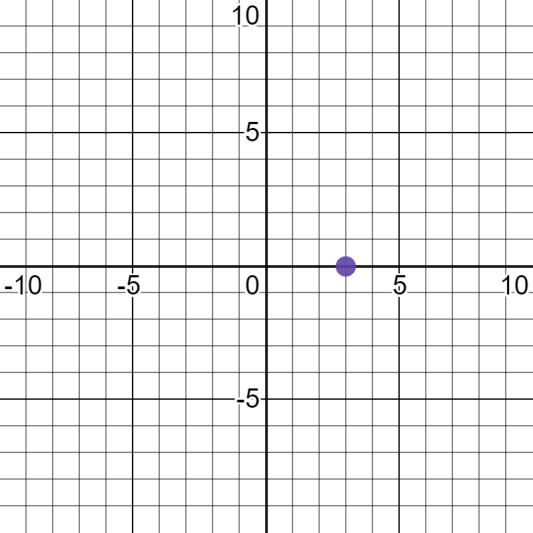
Now, we will graph the third point where
Where x=3 and y=0
This means the point will be 3 points away from y axis and 0 units away from x axis
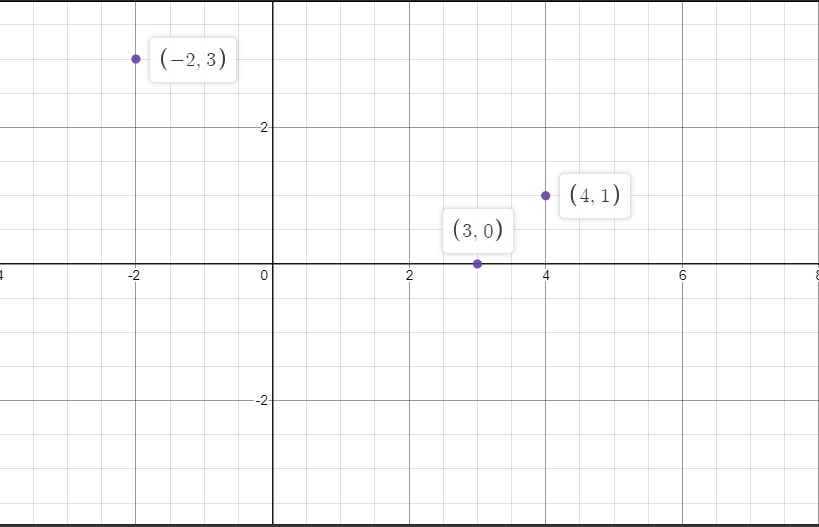
Now, if you want to see all the points together
It will look something like this:-
Note: Don't exchange the values of x or y. because the x value is for distance of a point from y axis and y value is for distance of a point from x axis. So (2,3) and (3,2) are totally different points. The distance from the axis and the value of the coordinate are of opposite signs ( X and Y ).