Question
Question: How do you plot the point \[(4,270\,\,\, degrees)\]...
How do you plot the point (4,270degrees)
Solution
Here in this question we have to plot the graph for the given points. Here we have the points in the polar form; we have converted it into Cartesian form. Hence by considering the points we plot the graph for the given question. hence the solution is obtained for the given question.
Complete step-by-step solution:
Here in this question, we have to plot the graph for the given function. A graph of a function is a set of ordered pairs and it is represented as y=f(x), where x and f(x) are real numbers. These pairs are in the form of cartesian form and the graph is the two-dimensional graph.
Here the given point is in the form of polar form. The general polar form is represented as (r,θ)
While converting the polar form into cartesian form x=rcosθ and y=rsinθ. Here the value of r is 4 and θ is 270∘.
Therefore the value of x and y is determined by
x=4cos(270∘)
The value of cos(270) is 0. Therefore the value of x is
The value of y is
y=4sin(270∘)
The value of sin(270) is -1. Therefore the value of x is
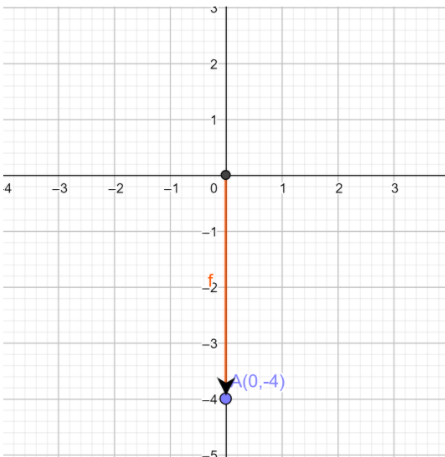
Here we have a point, usually the point is generally represented as (x,y). The first term represents the x value and the second term represents the y value. Here we have to plot the graph for the point (0,−4). Here when the x value is 0, then the value of y is -4. The point will be on the y axis.
From the origin of a graph we have to move 4 steps downwards for the point (0, -4).
Therefore the graph for the points is plotted as shown below:
Note: The graph is plotted x-axis versus y axis. The graph is two dimensional. By the equation of a graph, we can plot the graph by assuming the value of x. We can’t assume the value of y. because the value of y depends on the value of x. Hence, we have plotted the graph.