Question
Question: How do you plot the ordered pairs on the rectangular coordinate system \[(5.1,3.2)\] and \[(-2.5,4.9...
How do you plot the ordered pairs on the rectangular coordinate system (5.1,3.2) and (−2.5,4.9)?
Solution
From the question we are asked how can we plot the given ordered pairs on a rectangular coordinate plane. So, for solving this question we will take the values of x on the right and left of the plane and we will take the values of y ordinate to the top and bottom of the coordinate plane. Thus, we plot the given points.
Complete step-by-step solution:
Generally, to plot the given points or any other points on the coordinate grid:
For x value go to the right if the number is positive and we go to the left if the number is negative.
Then for the value of y ordinate we will go up if the number is positive and we go down if the number is negative.
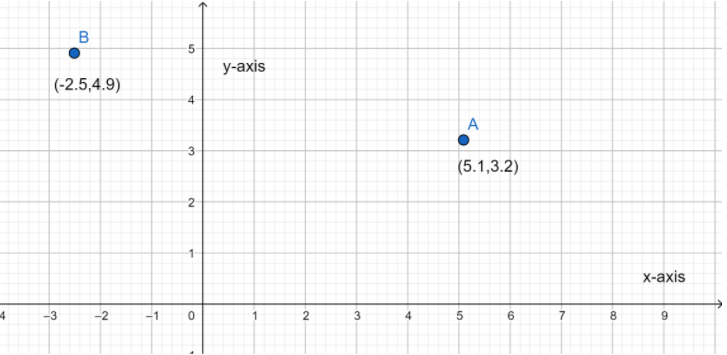
For the first plot (5.1,3.2)
Because the x value is positive go to the right 5.1 from the origin and then go up 3.2 as the y value is also positive.
For the second plot (−2.5,4.9)
Because the x value is negative go to the left 2.5 from the origin and then go up 4.9 because the y value is positive.
So, the graph will be as follows.
Note: Students should know how to plot points in a graph. We must know the coordinate plane system very thoroughly to solve questions of this sort. We must keep in mind that for negative points of x we will go to the left of origin and for negative y points we must go to the bottom of origin. We should not confuse this or else our solution may become wrong.