Question
Question: How do you plot the following graph: \(y = {x^2} + 1?\)...
How do you plot the following graph: y=x2+1?
Solution
In this question, we are going to find the values and plot the values in the graph.
The given equation is in the quadratic form so equate it to the quadratic formula.
Next, find the points (x,y) to plot the graph by giving values to x and then find the value of y.
Finally, Plot the points on the graph we get the required result.
Complete step-by-step solution:
In this question, we are going to find the points and then plot the points in the graph.
First write the given equation and mark it as (1)
y=x2+1...............(1)
The given equation is of the parabolic type.
Here y=x2+1 and it is positive so the general graph is a parabola and it is in the shape U.
The given equation is of the form y=ax2+bx+c
The bx part of the equation shifts the graph left or right.
We do not have any bx type of value in our equation.
So the graph is centered about the y−axis.
The c part of the equation is of value +1 so it lifts the vertex up from y=0 to y=1
Draw a table to construct the values of the graph
| x | −4 | −3 | −2 | −1 | 0 | 1 | 2 | 3 | 4 |
|---|---|---|---|---|---|---|---|---|---|
| x2 | 16 | 9 | 4 | 1 | 0 | 1 | 4 | 9 | 16 |
| 1 | 1 | 1 | 1 | 1 | 1 | 1 | 1 | 1 | 1 |
| y | 17 | 10 | 5 | 2 | 1 | 2 | 5 | 10 | 17 |
Draw our y-axis as a vertical line and our x-axis as a horizontal line.
Mark the relevant points for the x land y values.
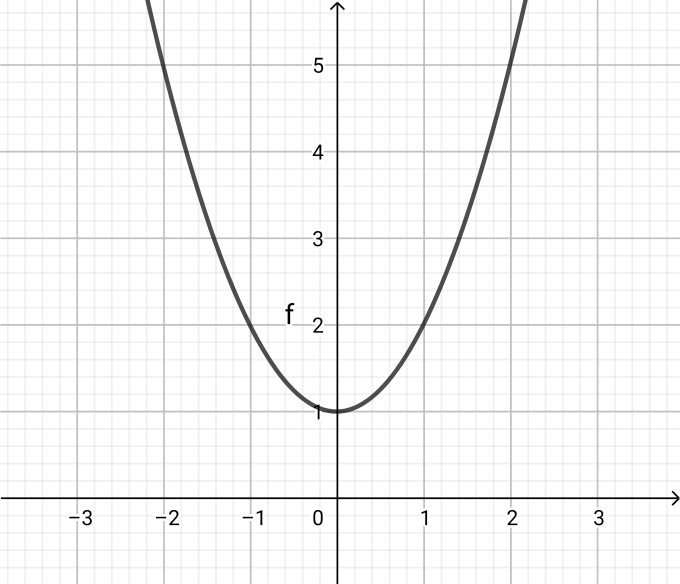
Draw the graph y=x2+1 as an upward parabola by marking those points.
The y values for both x=1 and x=−1are same, that is for both x the value of y is 2
The y values for both x=2,−2 are same, that is the value of y is 5
It is as same for x=3,−3,4,−4...
All these are plotted as (0,1),(1,2),(−1,2),(2,4),(−2,4),(3,10)(−3,10),(4,17),(−4,17)
And so on.
Graph:
Note: Graphs are a common method to visually illustrate relationships in the data. The purpose of graphs is to present data that are too numerous or complicated to be described adequately in the text and in less space.
Here is how to plot a graph of a function:
Calculate the first derivative
Find all the stationary and critical points
Calculate the second derivative
Find all points where the second derivative is zero.
Create a table of variation by identifying.