Question
Question: How do you plot Arrhenius equation?...
How do you plot Arrhenius equation?
Solution
While plotting a Arrhenius equation, the logarithm is taken on both side of the equation where rate constant (lnk) is plotted on the y-axis and the inverse of absolute temperature T1 is plotted on the x-axis.
Complete step by step answer:
The Arrhenius equation is the expression which shows the relation between rate constant, absolute temperature, and A factor.
The expression for Arrhenius equation is shown below.
k=Ae−Ea/RT
Where,
k is the rate constant of the chemical reaction.
A is the pre-exponential factor.
e is the base of natural logarithm
Ea is the activation energy
R is the universal gas constant.
T denotes the absolute temperature.
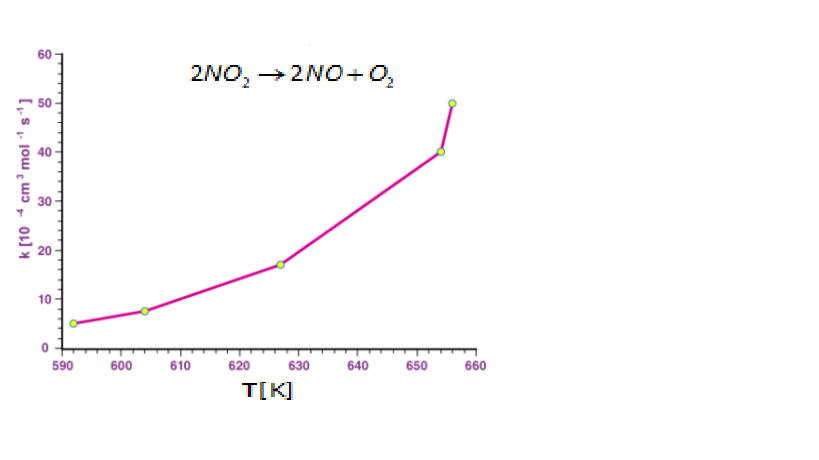
For the reaction
2NO2→2NO+O2
The graph is plotted where rate constant (k) is given on y-axis and absolute temperature is given on the x-axis.
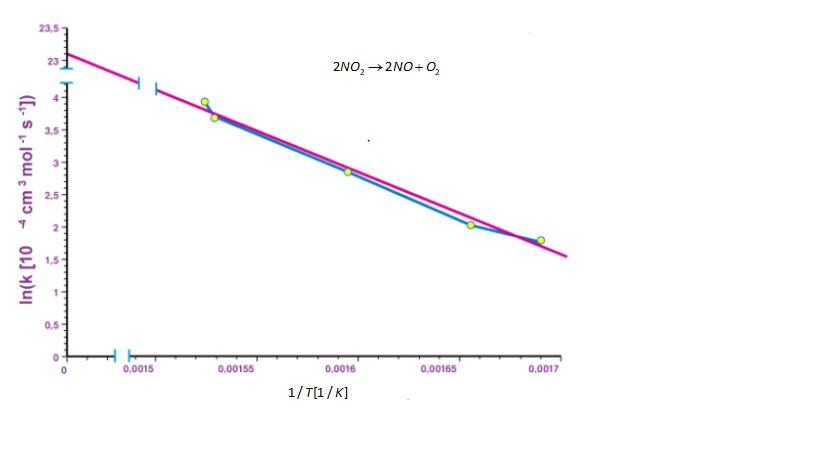
For the given reaction, when logarithm is taken on both sides of the equation, the Arrhenius equation is given as shown below.
lnk−ln(Ae−Ea/RT)
By solving the equation, we get
lnk=ln(A)+ln(e−Ea/RT)
lnk=ln(A)+(−Ea/RT)=ln(A)−(Ea/R)(1/T)
As, the lnA is constant, the equation corresponds to the straight line (y = mx + c) where slope m is REa When the logarithm of rate constant (lnk) is plotted on the y-axis and the inverse of absolute temperature T1 is plotted on the x-axis. The resulting graph obtained is known as Arrhenius plot.
The graph is shown below.
Note:
The rate of reaction is dependent on the temperature. As the temperature increases, the rate of reaction also increases and as the temperature decreases the rate of reaction also decreases. The pre-exponential factor A is represented by A=ρZ where ρ is the steric factor and Z is the frequency factor.