Question
Question: How do you plot \( ( - 2,8)? \)...
How do you plot (−2,8)?
Solution
we can plot a point on a graph by using measurement on X coordinate and Y coordinate of the graph. Measurement plan on a graph taking 1 cm in X axis as 1 units and also 1 cm in Y axis as 1 units. And then marked the coordinates.
Complete Step by Step Solution:
Now, given coordinate is (−2,8)
−2 is our X coordinate on the graph and the 8 is our Y coordinate on the graph.
Taking the X axis is the horizontal side of a graph and the Y axis is the vertical side of a graph.
Marked the origin point (0,0) . And then taking 1 cm in X axis as 1 units and also 1 cm in Y axis as 1 units. From the Origin right side of the X axis having positive number of units and left side of the X axis having negative number of units.
Similarly, in the Y axis, the upper side of the origin having positive number of units and lower side of the origin having negative number of units.
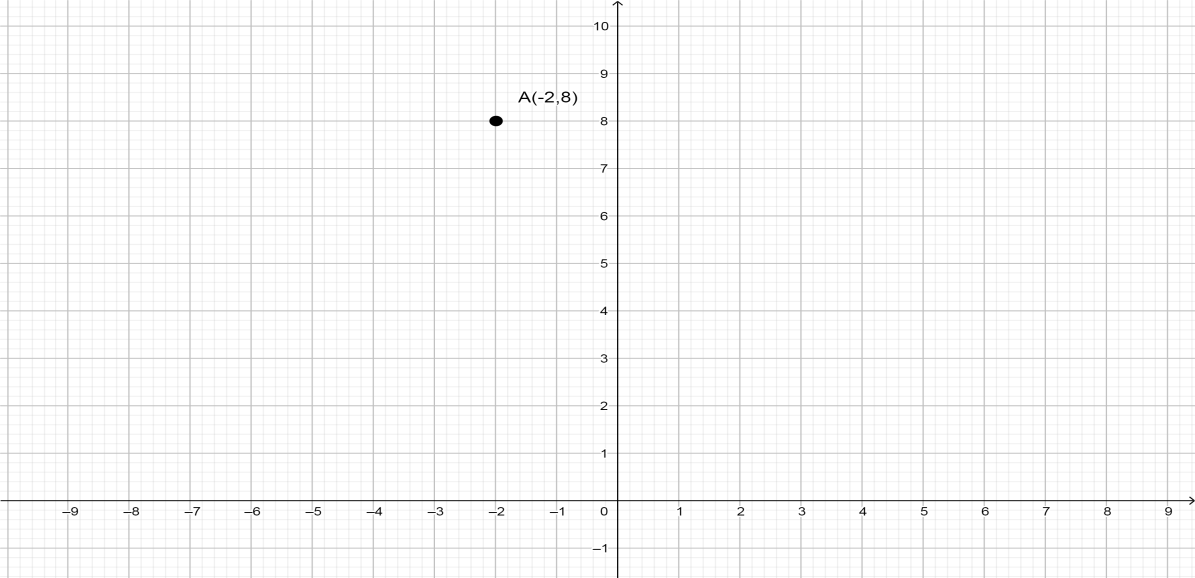
Now marked the number −2 in X axis. It is a negative number so it takes a place on the left side of the origin and then moves from that same position marked the number 8 vertically in the Y axis. It is a positive number so it takes a place in the upper side of the origin.
Now we will be −2 ticks left on the X axis and 8 ticks up on the Y axis.
The graph of the plot,
Note: To plot a point we need to have two things one is a point and another one is a coordinate plane.
A point in a plane contains two components where order matters.
A point comes in the form (x,y) where x comes first and y comes second.
A coordinate plane is composed of two lines intersecting at a 90 degree angle at the point (0,0) known as the origin