Question
Question: How do you make box – and - whisker plot of the average daily temperatures in Tucson, Arizona, in De...
How do you make box – and - whisker plot of the average daily temperatures in Tucson, Arizona, in December: 67,57,52,51,64,58,55,59,66,50,57,62,58,50,58,50,60,63?
Solution
The problem given above can be solved by sorting out the given data in ascending order and then finding the first quartile median, second quartile median and also the third quartile median by dividing the sorted values over here, after that we can make a box – and – whisker plot upon daily temperature in Tucson and Arizona as given in the problem.
Complete step-by-step answer:
Here first quartile Q1 refers to the median of first half of the data, and second quartile Q2refers to the median of whole sorted data that we have sorted or arranged in ascending order, and the third quartile Q3 refers to the median of the second half sorted data,
First let us sort the given data in ascending order,
Our sorted data is: 50,50,50,51,52,55,57,57,58,58,58,58,59,60,62,63,64,66,67,67
First quartile is the median of the first half of the data, i.e. first ten terms:
50,50,50,51,52,55,57,57,58,58
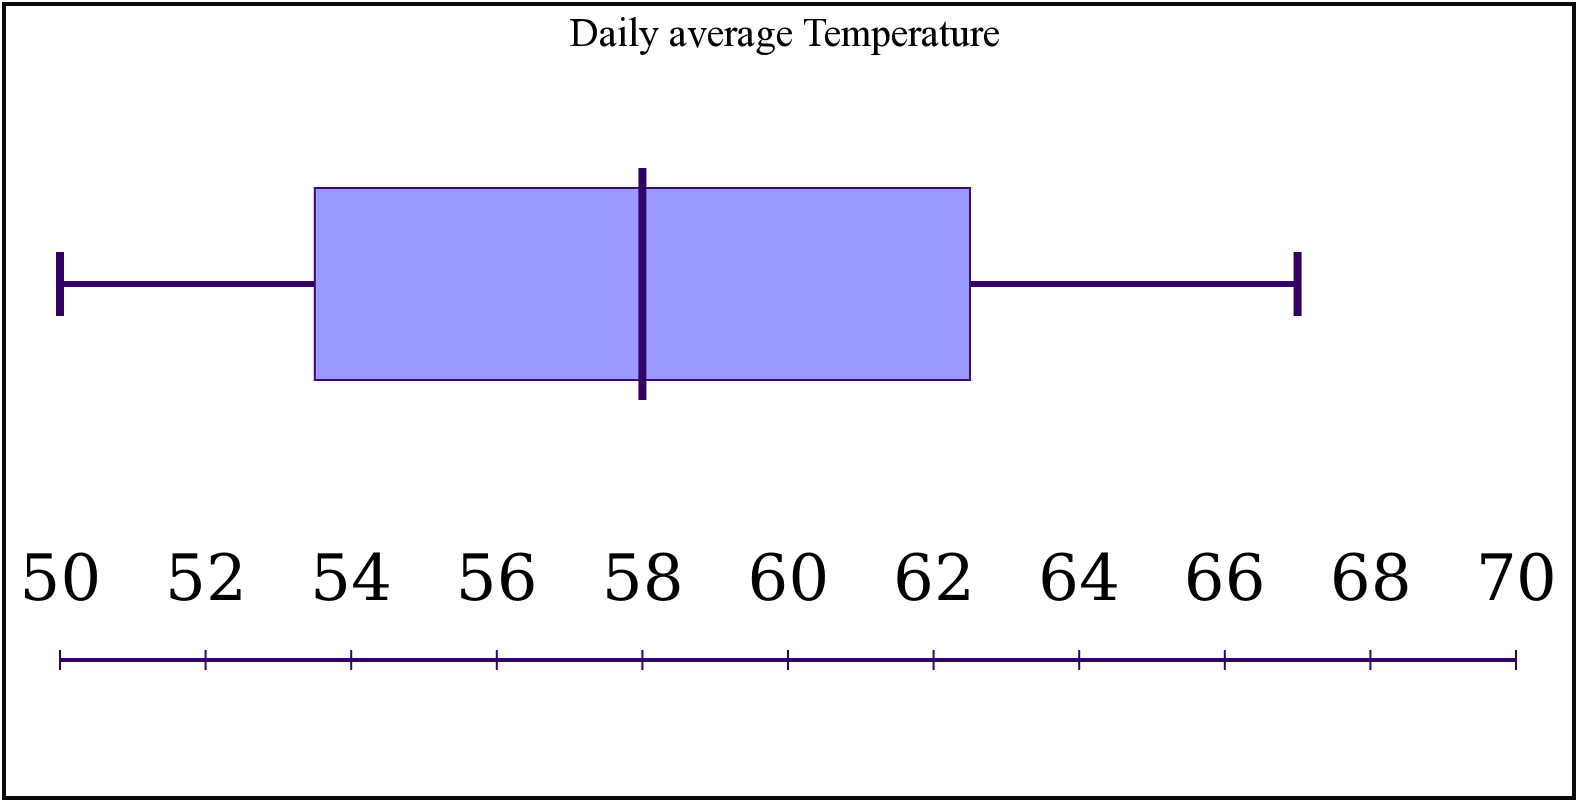
Clearly the first quartile or median of this first half data is Q1=53.5
The median of the complete sorted data is the second quartile and that is Q2= 58
Third quartile is the median of this second half data, i.e. second ten terms:
58,58,59,60,62,63,64,66,67,67
Clearly the third quartile or median of this second half data is Q3= 62.5
As we have got everything, we can now plot the graph:
Note: To solve this problem one should know about finding median and arranging the data in ascending or descending orders. Plotting the analyzed data with care has its own importance in this problem.