Question
Question: How do you make a Box and Whisker plot with the numbers: 60, 90, 90, 92, 100, 100, 100, 100?...
How do you make a Box and Whisker plot with the numbers: 60, 90, 90, 92, 100, 100, 100, 100?
Solution
We have been given a set of numbers whose box and whisker plot is to be made. We shall first find the five important values namely the minimum value, the Q1, the Q2 which is the median value, the Q3 value and the maximum value. Then we shall plot the intervals on the number line to finally sketch the box and whisker plot.
Complete step-by-step answer:
Given the set of numbers, 60, 90, 90, 92, 100, 100, 100, 100.
We shall first find the five values: the minimum value, the Q1, the Q2 which is the median value, the Q3 value and the maximum value.
Observing from all the given numbers, we see that the minimum value is 60 and the maximum value is 100.
The Q2 value or the median value is the middle number of the given series of numbers. However, since we have two numbers in the middle of the series, thus the median value will be equal to the average of both the middle values.
Q2=292+100
⇒Q2=2192
⇒Q2=96
Hence, the Q2 value or the median value is equal to 96.
We know that Q1and Q3 values are the medians of the two halves of the given data and the data is divided into two halves by its median or Q2 value.
The first half of the given numbers is 60, 90, 90, 92 and the two middle terms of this first half is 90 and 90. Thus, the Q1 value is equal to their average.
⇒Q1=290+90
⇒Q1=2180
⇒Q1=90
Now, the second half of the given numbers is 100, 100, 100, 100 and the two middle terms of this second half are 100 and 100. Thus, the Q3 value is equal to their average.
⇒Q3=2100+100
⇒Q3=2200
⇒Q3=100
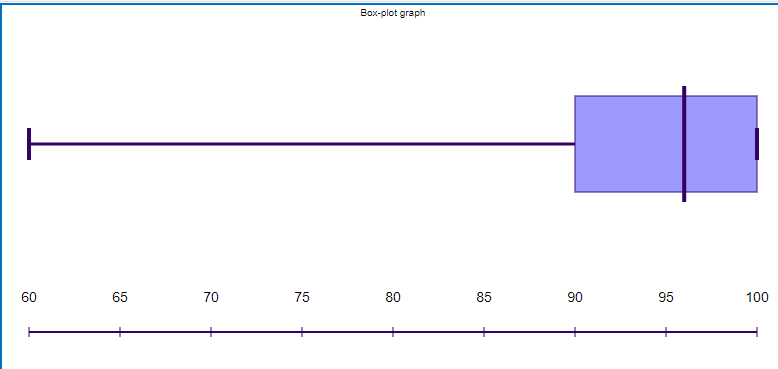
Finally, we shall plot all the numbers of the data on a number line and draw boxes from the Q1,Q2 and Q3 values. Then we will connect these boxes to the minimum and maximum values which are called the ‘whiskers’.
Therefore, the Box and Whisker plot is given as drawn below.
Note: We must keep in mind to arrange the given data or collection of numbers in the increasing or ascending order before proceeding to find the various values such as the minimum value, the Q1, the Q2 which is the median value, the Q3 value and the maximum value.