Question
Question: How do you graph \(y = x\sin \left( {\dfrac{1}{x}} \right)\)?...
How do you graph y=xsin(x1)?
Solution
This problem deals with plotting the graph of x and sinx1 together. The line y=x is similar to the straight line y=mx, where the slope of the line is 1, and it passes through the origin as it has no intercept, also when considered to plot the graph on the negative side of the x-axis, then the line becomes y=−x, here the slope of the line becomes negative which is equal to -1. We know that graph of sinx, we are going to combine these graphs.
Complete step-by-step solution:
As we know that the graph of sin(x) limits between -1 and 1, which is mathematically expressed below:
⇒sinx∈[−1,1]
Now we have to find the graph of sinx1, here the function of sine changed, but the trigonometric function didn’t change, so the graph of sinx1 also limits between -1 and 1.
But before sinx1, there is x in front of sinx1.
Here the x prior to sinx1 behaves as a scaling factor. As x grows large, the amplitude of the oscillation of the sine function also grows. Similarly, as x approaches zero, the amplitude shrinks.
Now looking at sinx1, we observe that as x approaches zero, x1 approaches ∞. Which means that as x→0, the sine function cycles through periods of 2π more and more rapidly.
Similarly, as x1→0, here x→±∞, meaning that it will take greater and greater changes in x to go through a full period of 2π.
After ∣x∣>π1 there will be no further oscillations, as we will have x1∈(0,π).
The resulting graph will have oscillations which grow in amplitude and are stretched further apart as x is further from zero, soon ceasing to oscillate at all, and which have smaller amplitudes and wilder oscillations closer to zero.
The graph of y=xsin(x1) is given below:
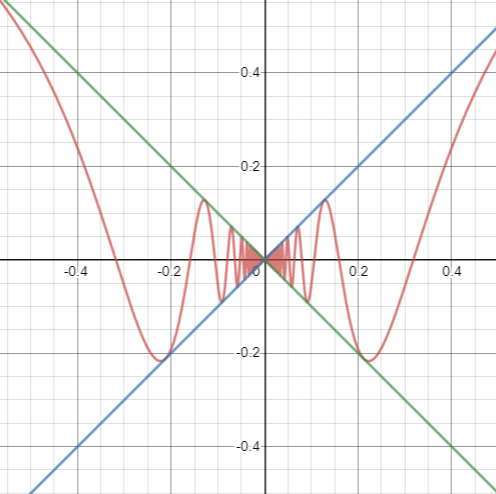
Note: Here we know that y=x passes through origin with positive slope and y=−x also passes through the origin but with negative slope, and the graph y=sinx1, starts from zero, where is oscillates between 1 and -1, but here as x and sinx1 come together, so the graph oscillates between the lines y=x and y=−x