Question
Question: How do you graph \(y = x - 7\) by plotting points?...
How do you graph y=x−7 by plotting points?
Solution
We have to plot a linear equation in two variables on the graph. The value of y is depending on x. The graph of such an equation is a straight line and we need a minimum of two points to draw a straight line. We can get these two points by assuming any values of x and getting corresponding values of y.
Complete step by step solution:
We have to plot y=x−7 on the graph. The given equation is an equation of a straight line. For plotting a straight line we need at least two points. This we can get by assuming any values of x and getting corresponding values of y.
We can assume x=0.
So when x=0,
y=x−7=0−7=−7
Thus we get one point as (0,−7) which satisfies the equation.
Similarly we can assume another value of x, let us say x=5.
So when x=5,
y=x−7=5−7=−2
Thus we get another point as (5,−2) which satisfies the equation.
We got two points using which we will plot our graph. On a graph plane we plot the two points and draw a straight line passing through these two points, extending both sides, as shown in the graph below.
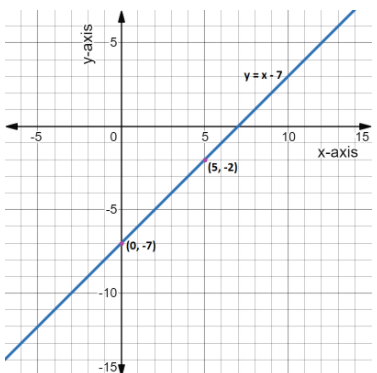
The resulting line shown in blue in the graph is the plotted graph of the equation y=x−7.
Note:
Although we need only two points for plotting the equation, we can find any number of points to plot the graph. Also the choice of value of x to find the points will not affect the graph. To show this we can find one more point and see whether this point lies on the plotted graph.
Let us assume x=−1. Then y=x−7=−1−7=−8
We get the third point as (−1,−8)
In the plotted graph we can see that the line is passing through (−1,−8) also.