Question
Question: How do you graph \(y=-x+6\)?...
How do you graph y=−x+6?
Solution
Change of form of the given equation will give the x-intercept and y-intercept of the line y=−x+6. We change it to the form of px+qy=1 to find the x intercept, and y intercept of the line as p and q respectively. then we place the points on the axes and from there we draw the line on the graph.
Complete step by step solution:
We are taking the general equation of line to understand the slope and the intercept form of the line y=−x+6. The given equation is in the form of y=mx+k. m is the slope of the line. The slope of the line is −1.
We have to find the x-intercept, and y-intercept of the line y=−x+6.
For this we convert the given equation into the form of px+qy=1. From the form we get that the x intercept, and y intercept of the line will bep and q respectively. The points will be (p,0),(0,q).
The given equation is y=−x+6. Converting into the form of px+qy=1, we get
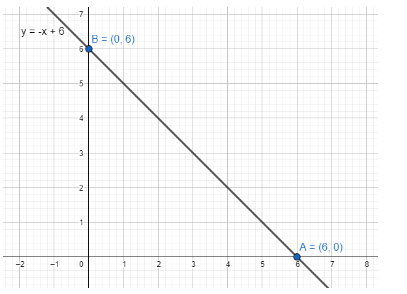
y=−x+6⇒x+y=6⇒6x+6y=1
Therefore, the x intercept, and y intercept of the line y=5x−3 is 6 and 6 respectively. The axes intersecting points are (6,0),(0,6).
Note: A line parallel to the X-axis does not intersect the X-axis at any finite distance. Hence, we cannot get any finite x-intercept of such a line. Same goes for lines parallel to the Y-axis. In case of slope of a line the range of the slope is 0 to ∞