Question
Question: How do you graph \[y={{x}^{2}}+6x+9\]?...
How do you graph y=x2+6x+9?
Solution
This type of question is based on the concept of plotting graphs for the quadratic equation. We have to first consider the given function and simplify the given function as much as possible. Since (x+3)2=x2+6x+9, we can simplify the given function as y=(x+3)2. Now, find the value of x when y=0 and find the value of y when x=0. Also consider a few points for x and substitute it in the obtained equation to find the corresponding value of y. Then, draw a table and mention the points x and y. plot the graph using this table.
Complete step-by-step solution:
According to the question, we are asked to plot a graph for y=x2+6x+9.
We have been given the function y=x2+6x+9. ----------(1)
First, we have to consider the equation (1).
Simplify the equation (1) with known formulas.
Here, y=x2+2×3x+32
This is of the form a2+2ab+b2, where a=x and b=3.
We know that (a+b)2=a2+2ab+b2.
Therefore, we get y=(x+3)2. --------------(2)
Now, let us consider y=0
We have to find the value of x.
(x+3)2=0
Taking square root on both the sides of the equation, we get
(x+3)2=0
⇒(x+3)2=0
We know that a2=a. Therefore, we get
x+3=0 [twice]
Subtracting 3 from both the sides of the equation, we get
x+3−3=0−3
⇒x=−3 [twice]
Since y is a quadratic equation, the curve crosses the x-axis at x=-3 twice.
Therefore, the point passes through (-3,0) twice.
When x=0, we have to find the value of y using the equation (2).
⇒y=(0+3)2
⇒y=(3)2
Since square of 3 is 9, we get
y=9
Therefore, the curve passes through the coordinate (0,9).
Also let x=-1
⇒y=(−1+3)2
⇒y=(2)2
∴y=4
Similarly let x=-2
⇒y=(−2+3)2
⇒y=(1)2
∴y=1
When x=-4
⇒y=(−4+3)2
⇒y=(−1)2
∴y=1
Similarly, when x=-5
⇒y=(−5+3)2
⇒y=(−2)2
∴y=4
To plot the graph, let us draw a table with points in the curve.
| x | 0 | -1 | -2 | -3 | -4 | -5 |
|---|---|---|---|---|---|---|
| y | 9 | 4 | 1 | 0 | 1 | 4 |
Also we have to note that the quadratic equation will always be parabola.
Let us now plot the graph with the following points.
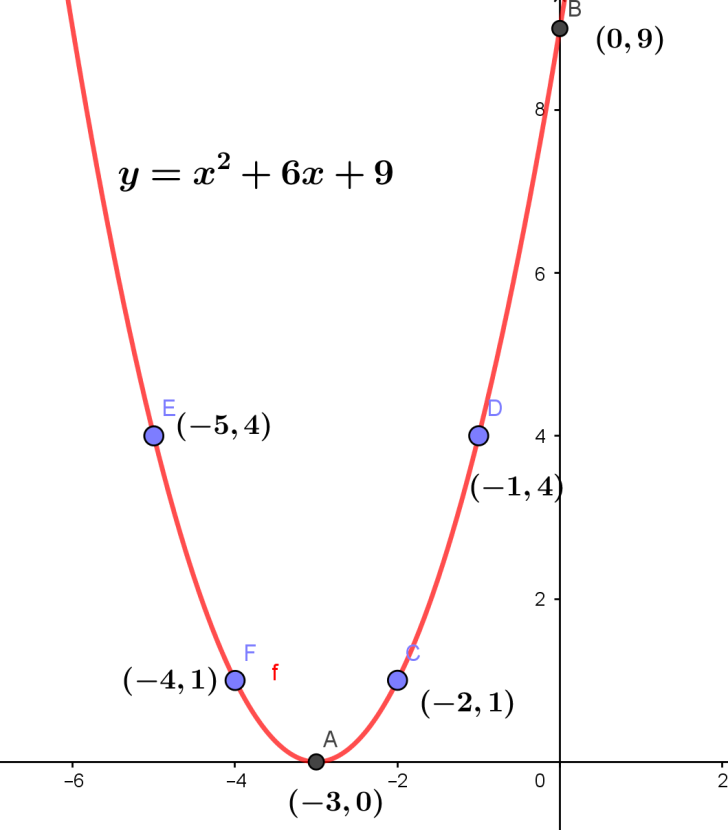
Therefore, the graph of y=x2+6x+9 is obtained.
Note: We should not simply draw straight lines between the points. Since the given equation is a quadratic equation, the graph will always be a parabola. Since we get the same values of y for different values of x, don’t consider the solution to be wrong. Avoid calculation mistakes while solving the points.