Question
Question: How do you graph \(y = {x^2} + 5x + 3?\)...
How do you graph y=x2+5x+3?
Solution
First of all, convert the given equation into a sum of two variables. Then draw a graph of y=x2 and then shift the graph rightward or left according as the term present in the square is subtracted or added with a variable. Then see if there is a constant left in the equation, if yes then shift the graph upward or downward according as the constant is being added or added. You will get the required graph.
Complete step by step solution:
In order to draw the graph of the given equation y=x2+5x+3 we will first simplify the equation as follows
⇒y=x2+5x+3 ⇒y=x2+2×25x+3
Now, adding and subtracting (25)2 in the right hand side of the equation in order to make a perfect square.
⇒y=x2+2×25x+(25)2−(25)2+3 ⇒y=(x+25)2−425+12 ⇒y=(x+25)2−413
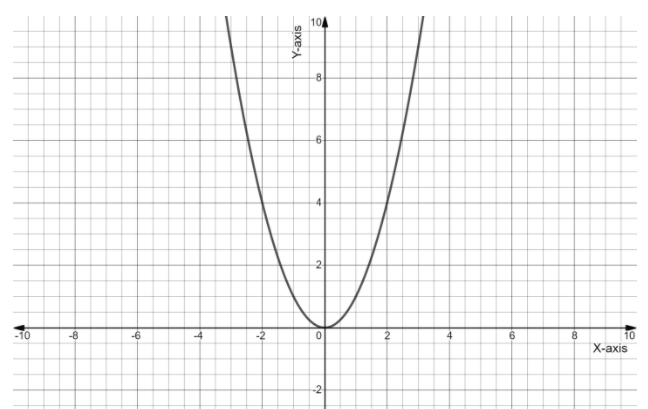
Now, we have simplified the equation in perfect square, so to draw the graph we will first plot the graph of y=x2
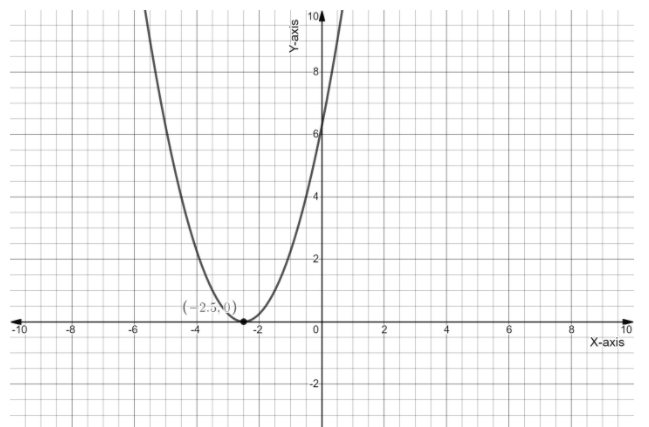
Now if we replace the argument of the function y=x2 with x+25 then it will be expressed a y=(x+25)2, since we have added 25 in the argument of the function, so we have to shift its graph 25 units left as follows
Now, we will subtract 413 from the equation y=(x+25)2, that is y=(x+25)2−413
So shifting the graph 413 units downward, we will get
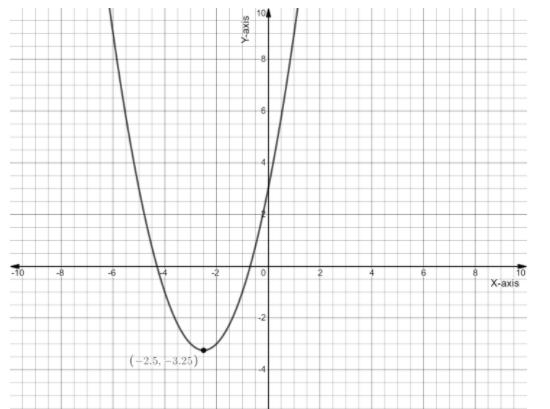
So this is the required graph.
Note:
The graph is being shifted to left or right side when a constant is being added or subtracted from the argument respectively and the graph is being shifted to downward or upward when a constant is being subtracted or added in the output of the equation.