Question
Question: How do you graph \(y = {x^2} - 2x + 2\)?...
How do you graph y=x2−2x+2?
Solution
First we express the function in the vertex form. Once we have found the vertex, we then move on to find the x-intercept and the y-intercept. After that we find the additional points by taking any value of x and finding the subsequent value for y using the given expression. Then we plot these points on the graph to get our required parabola.
Complete step-by-step solution:
In order to graph the given quadratic function, we first need to express it in the vertex form.
We know that the standard quadratic equation is expressed as ax2+bx+c=0 and vertex form is expressed as y=a(x−h)2+k .
Thus in order to transform a quadratic function in vertex form, we need to find the vertex first.
The coordinates of the vertex is given as (h,k)
In our given quadratic function y=x2−2x+2
Thus, a=1;b=−2;c=2
Now, h coordinate of the vertex is given as =2a−b=2−(−2)=1
We can find the k coordinate by substituting the values in the original quadratic function.
Let us replace variable y with k and variable x with h
Thus we have, k=h2−2h+2
⇒k=12−2+2=1
Therefore vertex =(h,k)=(1,1)
We can easily express the quadratic equation in vertex form now.
Therefore, y=(x−1)2+1
Since a>0 , therefore the parabola will be like a smile, that is it will be upside down. The vertex presents the lowest point of the parabola.
Now, we find the intercepts, that is the point at which the parabola cuts the x-axis and the y-axis
In order to find the y- intercept, let x=0
Given equation: y=(x−1)2+1
⇒y=(0−1)2+1
On simplifying, we get:
⇒y=1+1=2
Therefore y-intercept is (0,2)
Let us find the x-intercept now. In order to find x-intercept, we need to put y=0
Given equation: y=(x−1)2+1
⇒(x−1)2+1=0
On adding −1 to both sides, we get:
⇒(x−1)2=−1
As we know that −1=i which is an imaginary number.
Therefore, x−1=±i
⇒x=±i+1
Thus, the coordinates of x-intercept can be either (−i+1,0) or (+i+1,0)
Now let us find a few additional points to plot in our parabola:
Let x=−1
Therefore, y=(x−1)2+1
⇒y=(−1−1)2+1
⇒y=4+1=5
Additional coordinate E = (−1,5)
Let x=−2
⇒y=(x−1)2+1
⇒y=(−2−1)2+1
⇒y=9+1=10
Additional coordinate F= (−2,10)
Let us plot these points in the graph:
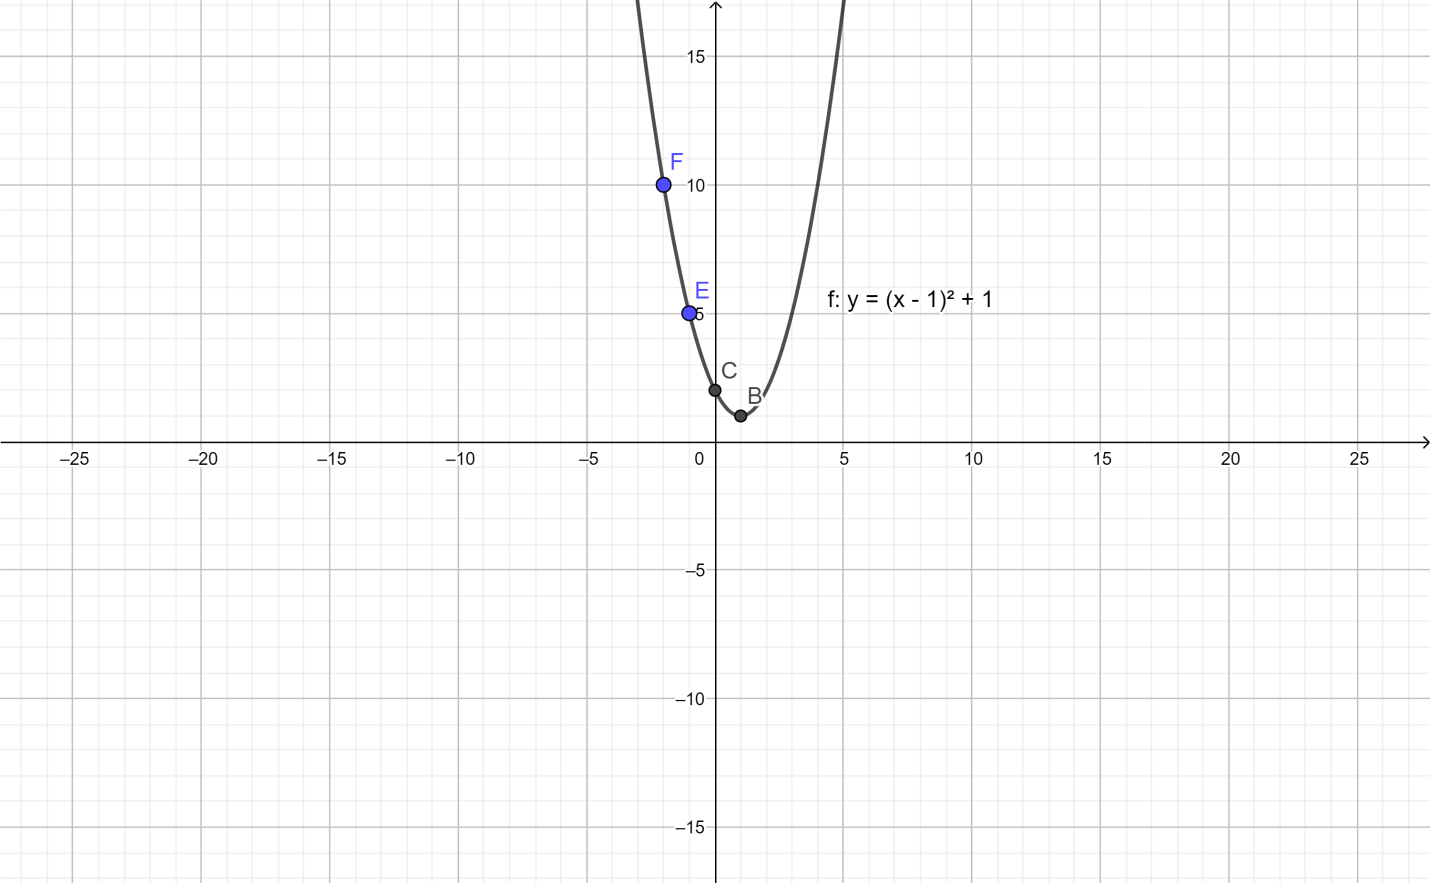
Here
E and F are the additional points (−1,5) and (−2,10) respectively.
B is the vertex (1,1)
And C is the y-intercept.
Note: The graph of a quadratic function is a parabola. The vertex is nothing but the highest or lowest point of a parabola, depending if it's downward shaped or upward shaped respectively. The shape of the parabola is determined by the coefficient a of the quadratic function.
If a>0, then the graph makes a smile, which means it is an upward graph.
If a<0, then the graph makes a frown, which means it is a downward graph