Question
Question: How do you graph \[y=\tan \left( 2x \right)\]?...
How do you graph y=tan(2x)?
Solution
For solving this question, we should know that if f(x) (that is called a function of x) has a period of T, then the period of f(kx) will be kT. In solving this question, first we will calculate the period of tan(2x). After that we will draw the graph of tan(2x).
Complete step by step answer:
Let us solve the question.
As we know that period of tan(x) is π.
The graph of y=tan(x) is:
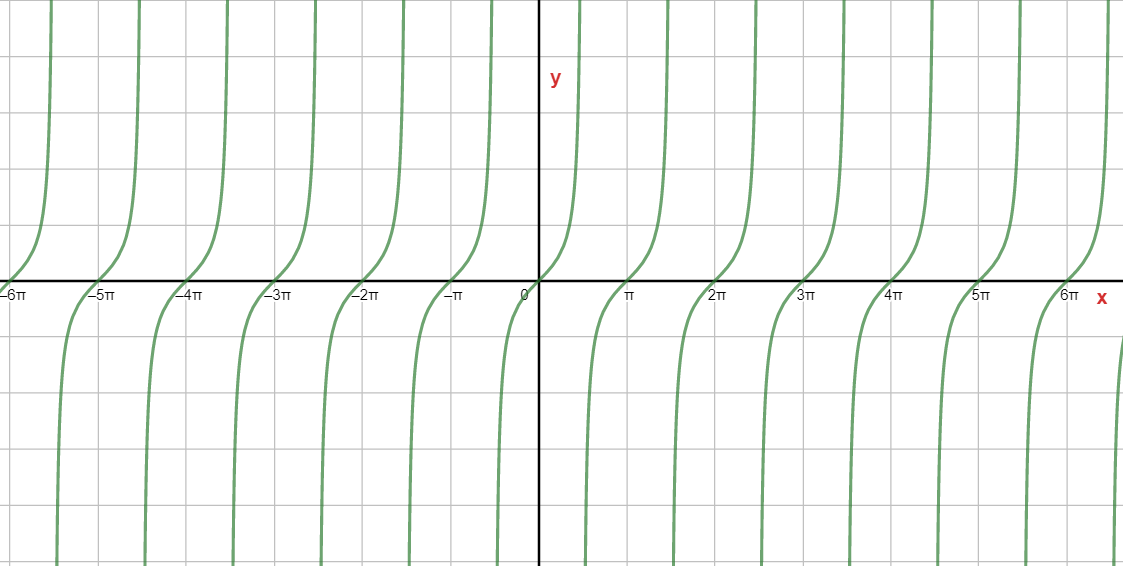
Here, in the above graph, the value of x is given along x-axis and the value of tanx is given along y-axis.
As it is seen from the above graph that after every π units, the tanx is repeating.
Let us find out the period of tan2x.
As we know that if period of a function f(x) is T. Then, the period of f(kx) is kT , where k is any real number.
Now, applying the above procedure in tanx.
If tanx has a period of π
Then, we can say that
tan(2x) has a period of 2π.
If tanx has a period of π, that means the graph of tanx is repeating after every π units.
Then, tan(2x) has a period of 2π, that means the graph of tan(2x) will be repeating after every 2π units.
Therefore, the graph of tan(2x) will be:
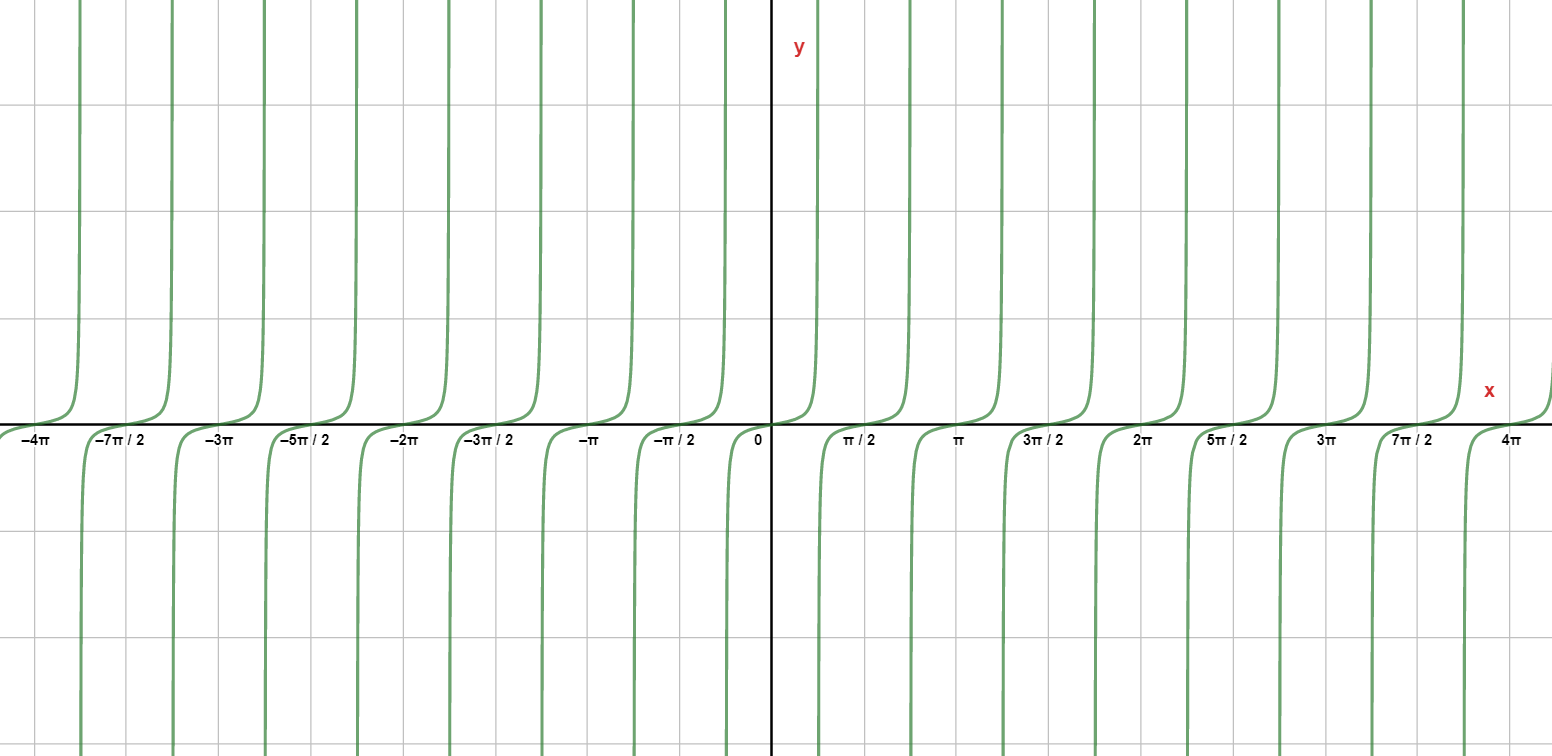
In the above graph, the value of x is given along the x-axis and the value of tan(2x) is given along the y-axis.
We can see from the above graph that the tan(2x) is repeating after every 2π units.
This graph is 2 times faster than first.
Note: Remember the period of trigonometric functions to solve this type of problems. And we should have a proper knowledge in periodic functions also. As stated above that the period of f(kx) is kT. Here, k can be any real number. But, make sure that k should not be zero. Otherwise, the process will be wrong in that case.