Question
Question: How do you graph \(y=\tan 2x\)?...
How do you graph y=tan2x?
Solution
To graph the above trigonometric function, we will first graph the trigonometric function y=tanx then the function which we have to graph has the angle two times of that of tanx so the values of x that this tan2x will be half of that of tanx to achieve the same pattern of the graph as that of tanx.
Complete step by step answer:
The trigonometric function which we have to draw on the graph is as follows:
y=tan2x
To draw the above graph, we are going to draw y=tanx first and this graph of y=tanx we already know from the standard graphs of the trigonometric functions. So, the graph of y=tanx is as follows:
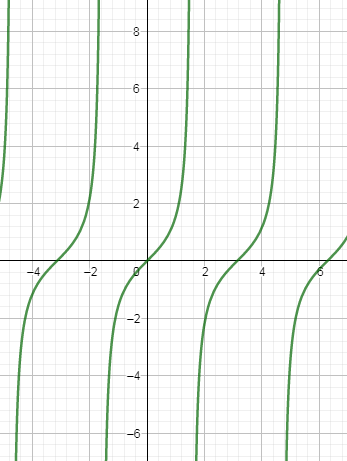
Now, in the graph of y=tan2x, the values of x will be changed with respect to tanx. And we have demonstrated the change as follows: We know that tanx=1 is possible when x=4π and tan2x=1 when 2x=4π and then the value of x is calculated by dividing 2 on both the sides of the equation in x.
22x=2(4)π⇒x=8π
As you can see that the value of x in tan2x becomes one half of the value of x in tanx.
The values of x at which tan2x is drawn is half of the values of x at which tanx is drawn so keeping in mind this concept we are going to draw the graph of tan2x.

Hence, we have drawn the graph of y=tan2x as follows:
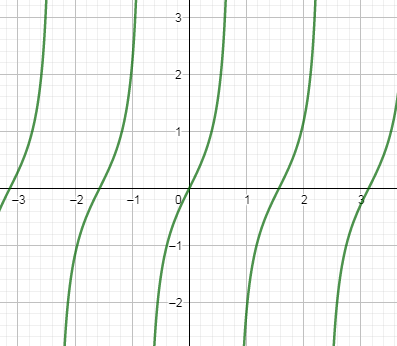
Note: In the above graph of y=tan2x , as you can see that the function becomes 0 when the value of x is around 1.5 and we know that the value of 2π=1.57 so tan2x=0 when x=2π.
In the graph of tanx, it will be 0 in the multiple of π means when x=π then the function becomes 0 and in the graph of tan2x, it is 0 when x=2π and as this value of x is half of π. Hence, we have drawn the correct graph.