Question
Question: How do you graph \(y = \sqrt {x + 5} \), compare it to the parent graph and what is the domain and r...
How do you graph y=x+5, compare it to the parent graph and what is the domain and range?
Solution
We are given a graph of function and we have to compare it to the parent graph to find its domain and range. Domain is all x-values or inputs of a function and the range is the all y-values or outputs of a function. The parent graph is the graph or the parent function which is the root function. That parent graph transformed horizontally or vertically depends on the function if any digit is added in the function then the function graph shifts that much unit in the left. For example f(x) is the parent function so we will name its graph as the parent graph. On adding the C into it. It becomes f(x+c) then f(x) shifts left units. After drawing both the graphs we can easily spot the difference between the two graphs.
Complete step-by-step answer:
Step1: We are given a function and first we will find its domain and range. For domain the conditions are as the number inside the square cannot be zero so
∴x+5=0
On solving we will get x=−5
And the value inside the square root will always be positive.
∴x+5⩾0
From above conditions domain includes all real number from −5 to +∞
Domain x ∈[−5+∞)
Range i.e. output value will include all positive real numbers excluding zero.
Range y ∈[0,+∞)
Step2: Now the parent graph is y=x. Although the true square root is ± it is not stated As such in the question. We only have + this is what we called the principal square root. The condition± produces the shape ⊂ so as we only have the positive half of the condition ± we end up with only the top half of the shape ⊂. For the value NOT go into the complex number set of values the ‘content’ of the root must not become negative. The minimum value is such that:
⇒x+5=0
⇒x=−5
The action of changing
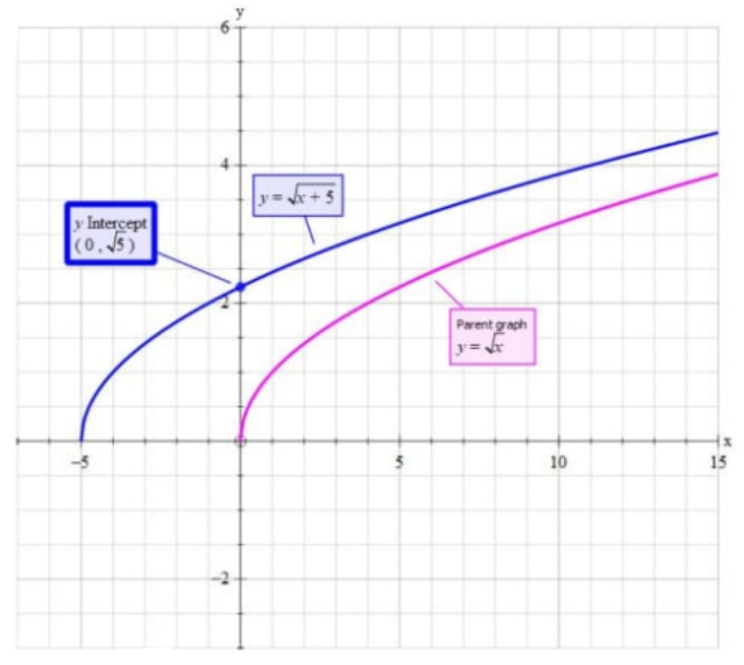
y=xtoy=x+5 ’moves’ the graph of y=x to the left on the x-axis by 5.
The x-intercept is at y=0=x+5 thus x-intercept=-5
The y-intercept is at x=0
⇒y=5≈2.24
We will plot both the graphs and find the difference between the graphs.
Hence domain is x ∈[−5+∞) and range is y ∈[0,+∞)
Note:
In such type of question students mainly do mistakes in drawing the graph because many students get scared only by the name of graph for the students first find the range and domain for such type of functions graph draw the parent graph every function has a parent function like in this square root function x as the parent function after this the graph only undergo transformation according to the function. Following transformation can also took place according to the function:
F(x+c) shifts F(x) to the left c units
F(x-c) shifts F(x) right c units.