Question
Question: How do you graph \(y=\sqrt{x}+5\)?...
How do you graph y=x+5?
Solution
To draw a graph of the given equation first we need to find the domain and range of the given equation. Domain is the input of a function and range is the output of a function. Then by finding the values we will plot a graph.
Complete step by step solution:
We have been given an equation y=x+5.
We have to plot a graph for the given equation.
We know that to plot a graph we have to find the domain and range of the given equation. As we know that domain is the input or x values of a function and range is the output or y values of a function.
For domain the number inside the square cannot be zero. i.e. x=0 and the values inside the square root will always be positive.
Now, we know that range is the output value which includes all positive real numbers excluding zero.
Now, plotting a graph of the given equation we will get
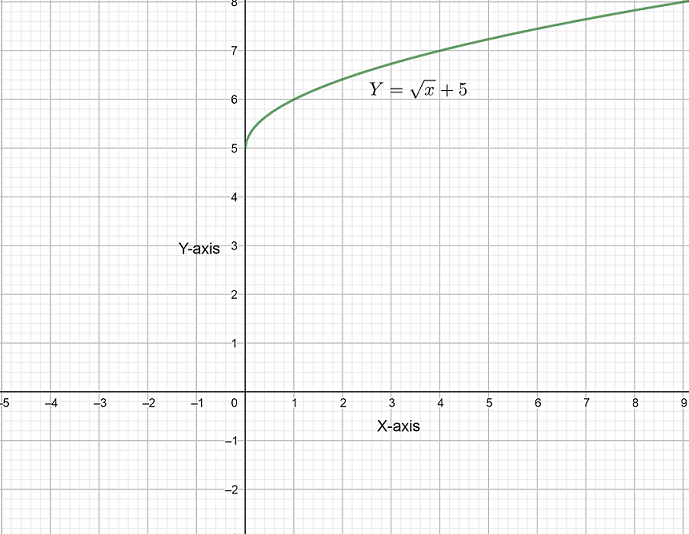
Hence above is the required graph of the given equation.
Note: The point to be noted is that every function has a parent function, so students may try to draw a parent graph first and then draw a function graph accordingly. The parent graph is the graph or parent function which is the root function.