Question
Question: How do you graph \(y=\sin x\) and \(y=\cos x\) ....
How do you graph y=sinx and y=cosx .
Solution
To draw the graph of y=sinx , we have to consider different values of x and find the corresponding values of y. We have consider x=0,±2π,±π,±23π,±2π and find the corresponding values of y. To draw the graph of y=cosx , we will do the similar procedure.
Complete step by step solution:
We have to graph y=sinx and y=cosx . Let us first consider y=sinx . We have to consider different values of x and find the corresponding values of y.
Let us consider x=0 . We have to substitute the value of x in y=sinx .
⇒y=sin0=0
Let us consider x=2π .
⇒y=sin2π=1
We have to consider x=π .
⇒y=sinπ=0
Let us consider x=23π .
⇒y=sin23π=−1
We have to consider x=2π .
⇒y=sin2π=0
Now, let us consider the negative values. So when x=−2π
⇒y=sin(−2π)
We know that sin(−θ)=−sinθ .
⇒y=−sin(2π)=−1
We have to consider x=−π .
⇒y=sin(−π)=0
Let us consider x=−23π .
⇒y=sin(−23π)=−sin(23π)=1
We have to consider x=−2π .
⇒y=sin(−2π)=0
Let us tabulate these values.
| x | y=sinx |
|---|---|
| 0 | 0 |
| 2π | 1 |
| π | 0 |
| 23π | -1 |
| 2π | 0 |
| −2π | -1 |
| −π | 0 |
| −23π | 1 |
| −2π | 0 |
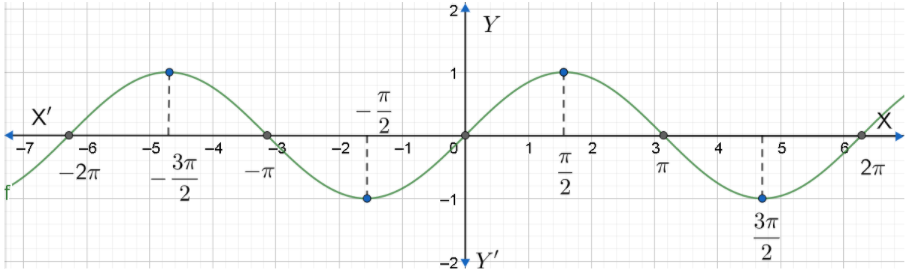
Now, let us plot the graph. Firstly, we have to plot the points in the graph. We have to convert π into its numerical form, that is, 3.14 and plot the corresponding points. Then, we have to join the points as a curve. The graph of y=sinx is shown below.
Now, let us consider y=cosx . Similar to the previous function, we will have to find the points to plot.
Let us consider x=0 . We have to substitute the value of x in y=cosx .
⇒y=cos0=1
Let us consider x=2π .
⇒y=cos2π=0
We have to consider x=π .
⇒y=cosπ=−1
Let us consider x=23π .
⇒y=cos23π=0
We have to consider x=2π .
⇒y=cos2π=1
Now, let us consider the negative values. So when x=−2π
⇒y=cos(−2π)
We know that cos(−θ)=cosθ .
⇒y=cos(2π)=0
We have to consider x=−π .
⇒y=cos(−π)=cosπ=−1
Let us consider x=−23π .
⇒y=cos(−23π)=cos(23π)=0
We have to consider x=−2π .
⇒y=cos(−2π)=cos(2π)=1
Let us tabulate these values.
| x | y=sinx |
|---|---|
| 0 | -1 |
| 2π | 0 |
| π | -1 |
| 23π | 0 |
| 2π | 1 |
| −2π | 0 |
| −π | -1 |
| −23π | 0 |
| −2π | 1 |
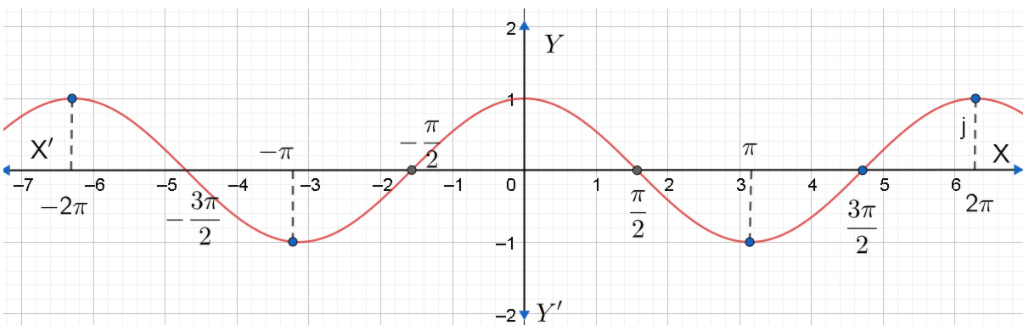
Now, let us plot the graph.
Note: We can also consider other angles also. Students have a chance of making mistakes by considering sin(−θ)=sinθ and cos(−θ)=−cosθ . We have considered the values of x to be x=0,±2π,±π,±23π,±2π as these values are easy to be plotted. We can find the domain and range of y=sinx and y=cosx . We know that the domain of a function is the complete set of possible values of the independent variable. Hence, the domain of sin x and cos x is (−∞,∞) . We know that range of a