Question
Question: How do you graph \[y = \sin \left( {x + \pi } \right)\] ?...
How do you graph y=sin(x+π) ?
Solution
Hint : Here in this question, we have to plot the graph of a given trigonometric function. To solve this better we have to find the amplitude and period. By comparing given trigonometric function in to the standard form of asin(bx−c)+d where, to Find the amplitude = ∣a∣ , then Find the period using the formula ∣b∣2π , bc represent the phase shift and d represent the vertical shift and later we have to find the table of values, using all these we can plot the required graph.
Complete step by step solution:
Consider the given trigonometric function:
⇒y=sin(x+π) -------(1)
Let the above equation be similar to the form of equation i.e., asin(bx−c)+d to find the variables used to find the amplitude, and period.
Now consider the given expression y=sin(x+π)
Where,
a=1
b=1
c=−π
d=0
The Amplitude is the height from the centre line to the peak (or to the trough). Or we can measure the height from highest to lowest points and divide that by 2.
To Find the amplitude = ∣a∣ .
⇒ Amplitude =∣a∣=∣1∣=1 .
Then in the graph
Phase shift bc=1−π=−π .
Vertical shift up by d=0 .
Period is the complete revolution of a wave completing crest and followed by trough
Otherwise.
The Period goes from one peak to the next (or from any point to the next matching point):
Find the period using the formula ∣b∣2π
⇒ Period =∣1∣2π=12π=2π .
Now, find the table of values by given x values to the function i.e.,
| x | −π | −2π | 0 | 2π | π |
|---|---|---|---|---|---|
| y=sin(x+π) | 0 | 1 | 0 | −1 | 0 |
| (x,y) | (−π,0) | (−2π,1) | (0,0) | (2π,−1) | (π,0) |
The sketch of the given function y=sin(x+π) is:
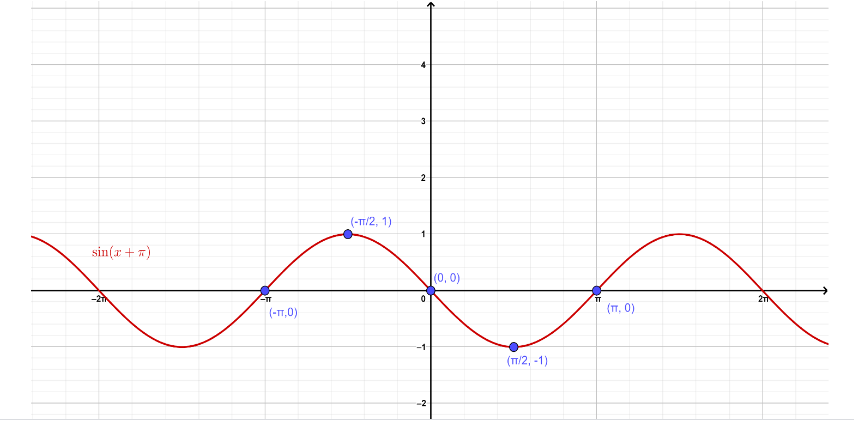
Note : The period is the length of the smallest interval that contains exactly one copy of the repeating pattern. The Amplitude is the height from the centre line to the peak. We use the form of equation i.e., asin(bx−c)+d and we have formula for the period and amplitude and hence we determine the values.