Question
Question: How do you graph \(y = \sin \left( {x + 30^\circ } \right)\)?...
How do you graph y=sin(x+30∘)?
Solution
To solve this question, we will use the graph for the basic sine function which is sinx. It is important to know that when we add or subtract from an angle, the graph will shift left or right. In this problem, 30∘is added to x and therefore the graph will shift to the left.
Complete step by step solution:
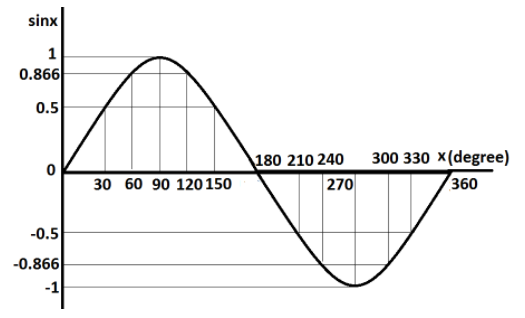
First we will see the graph of sinx.
Let us plot the graph of sinx for the values of xstarting from 0∘to 360∘ at the interval of 30∘.
This table shows the values of the function sinx for different values of x.
| x(degree) | sinx |
|---|---|
| 0 | 0 |
| 30 | 23=0.866 |
| 60 | 23=0.866 |
| 90 | 1 |
| 120 | 23=0.866 |
| 150 | 23=0.866 |
| 180 | 0 |
| 210 | −21=−0.5 |
| 240 | −23=−0.866 |
| 270 | −1 |
| 300 | −23=−0.866 |
| 330 | −21=−0.5 |
| 360 | 0 |
Now, we will plot the graph of y=sin(x+30∘) for the values of x starting from 0∘ to 360∘ at the interval of 30∘.
The following table shows the values of the function y=sin(x+30∘) for different values of x.
| x(degree) | (x+30)(degree) | y=sin(x+30) |
|---|---|---|
| 0 | 30 | 23=0.866 |
| 30 | 60 | 23=0.866 |
| 60 | 90 | 1 |
| 90 | 120 | 23=0.866 |
| 120 | 150 | 23=0.866 |
| 150 | 180 | 0 |
| 180 | 210 | −21=−0.5 |
| 210 | 240 | −23=−0.866 |
| 240 | 270 | −1 |
| 270 | 300 | −23=−0.866 |
| 300 | 330 | −21=−0.5 |
| 330 | 360 | 0 |
| 360 | 390 | 23=0.866 |
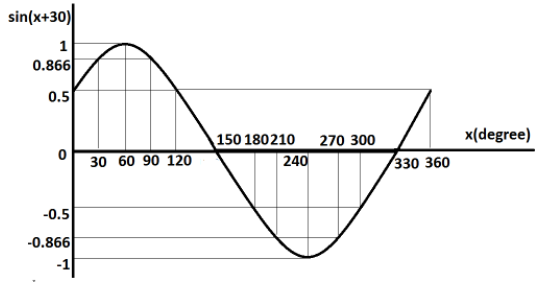
Thus, by this method, we can graph the function y=sin(x+30∘).
Note:
In this question, if we compare both the graphs, it is clearly seen that both are of the same shape. The only difference is that the second graph which is of the function y=sin(x+30∘) has shifted to the left by 30 degree then the graph of the function sinx. This is because here, 30 degrees is added to the angle. If this 30 degree is subtracted from the angle, the similar graph would be obtained but it would be shifted to right.