Question
Question: How do you graph \(y=\sin \left( \dfrac{1}{3}x \right)\) ?...
How do you graph y=sin(31x) ?
Solution
In order to graph any function, we must know an ample number of points on it in order to trace it through them. Some of which are the stationary and critical points and the points of inflection. Inflection points are those where the second derivative of the graph is zero. We must also know the intervals between the critical and inflection point and whether the function is increasing or decreasing in these intervals.
Complete step-by-step answer:
For the function f(x)=sin(31x), the amplitude of this function remains the same, that is, 1 but the period changes.
For any sinusoidal function, f(x)=AsinBx, A represents the amplitude of sine function and B2π represents the period of the sine function.
Since B=31, therefore, for f(x)=sin(31x), the period is equal to 312π=6π. Thus, the graph starts repeating itself after 6π.
Let us take five points in one period on this graph now.
x1=0x2=23πx3=3πx4=29π
x5=6π
Now, put the x-coordinate of these points in the function y=sin(31x) to find the y-coordinate of the points.
When x1=0, y1=sin(31.0)=sin0=0
When x2=23π, y2=sin(31.23π)=sin2π=1
When x3=3π, y3=sin(31.3π)=sinπ=0
When x4=29π, y4=sin(31.29π)=sin23π=−1
When x5=6π, y5=sin(31.6π)=sin2π=0
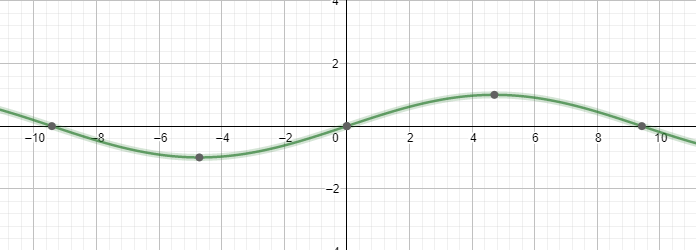
Therefore, the points are (0,0),(23π,1),(3π,0),(29π,−1) and (6π,0).
These points are sufficient to draw the graph of the given function.
Note:
The graph of sinx is very well known to us. It is a periodic function with a period of 2π. The amplitude of this function is 1, that is, the range of the function lies in [−1,1] and the domain of the function is all real numbers, R.