Question
Question: How do you graph \[y = \sin 2x\]?...
How do you graph y=sin2x?
Solution
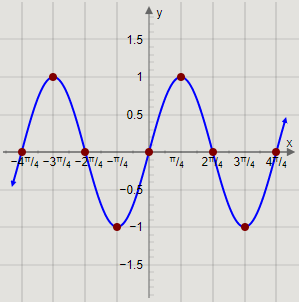
We need to graph the given function. We will use the domain and some values of x lying between −π and π to find some values of y. Then, we will use the values of y to find the coordinates of points lying on the required graph, and use the coordinates obtained to graph the function.
Complete step-by-step solution:
The domain of all sine functions is the set of all real numbers.
Thus, the domain of the function y=sin2x is given by \left\\{ {x:x \in R} \right\\}. This means that the function y=sin2x exists for all values of x, and is a continuous function.
Now, we will find some values of y for some values of x lying between −π and π.
Substituting x=−π in the function y=sin2x, we get
y=sin(2(−π)) ⇒y=sin(−2π)
The sine of an angle −x can be written as sin(−x)=−sinx.
Simplifying the expression, we get
⇒y=−sin(2π) ⇒y=0
Substituting x=−43π in the function y=sin2x, we get
⇒y=sin(2(−43π)) ⇒y=sin(−23π)
As sine function is an odd function, so we can writ above equation as
⇒y=−sin(23π)
Substituting the value of the angle, we get
⇒y=1
Substituting x=−2π in the function y=sin2x, we get
⇒y=sin(2(−2π)) ⇒y=sin(−π)
As sine function is an odd function, so we can writ above equation as
⇒y=−sin(π) ⇒y=0
Substituting x=−4π in the function y=sin2x, we get
⇒y=sin(2(−4π)) ⇒y=sin(−2π)
Substituting the value of the angle, we get
⇒y=−1
Substituting x=0 in the function y=sin2x, we get
⇒y=sin(2(0)) ⇒y=sin(0)
Substituting the value of the angle, we get
⇒y=0
Substituting x=4π in the function y=sin2x, we get
⇒y=sin(2(4π)) ⇒y=sin(2π)
Substituting the value of the angle, we get
⇒y=1
Substituting x=2π in the function y=sin2x, we get
⇒y=sin(2(2π)) ⇒y=sin(π)
Substituting the value of the angle, we get
⇒y=0
Substituting x=43π in the function y=sin2x, we get
⇒y=sin(2(43π)) ⇒y=sin(23π)
Substituting the value of the angle, we get
⇒y=−1
Substituting x=π in the function y=sin2x, we get
⇒y=sin(2(π)) ⇒y=sin(2π)
Substituting the value of the angle, we get
⇒y=0
Arranging the values of x and y in a table and writing the coordinates, we get
| x | y | (x,y) |
|---|---|---|
| −π | 0 | (−π,0) |
| −43π | 1 | (−43π,1) |
| −2π | 0 | (−2π,0) |
| −4π | −1 | (−4π,−1) |
| 0 | 0 | (0,0) |
| 4π | 1 | (4π,1) |
| 2π | 0 | (2π,0) |
| 43π | −1 | (43π,−1) |
| π | 0 | (π,0) |
Now, we will use the coordinates of the points to plot the required graph.
Plotting the graphs and joining the curve, we get

This is the required graph of the function y=sin2x.
Note:
The period of a function y=sinkx is given by k2π. The period of the function y=sin2x is 22π=π. This means that the graph of y=sin2x will repeat for every π distance on the x-axis. It can be observed that the pattern and shape of the graph of y=sin2x is the same from −π to 0, and from 0 to π. The range of the sine function is from −1 to 1.
