Question
Question: How do you graph \(y=\sec \left( \dfrac{x}{2} \right)\)?...
How do you graph y=sec(2x)?
Solution
We explain the main function of the given equation y=sec(2x). We take the general equation and explain the amplitude, period. Then we equate the given function y=sec(2x) with the general one and find the graph.
Complete step by step solution:
We need to find the amplitude, period for y=sec(2x).
The main function of the given equation is secx. The period of cosx is 2π.
We define the general formula to explain the amplitude, period for secx.
The secx changes to Asec[B(x+C)]+D, the amplitude and the period becomes ∣A∣ and ∣B∣2π.
Now we explain the things for the given y=sec(2x).
y=sec(2x)=1×sec[21×x]. We equate with Asec[B(x+C)]+D.
The values will be ∣A∣=1;∣B∣=21. The period is 212π=2π×2=4π.
Therefore, the amplitude and period for y=sec(2x) is 1,4π respectively.
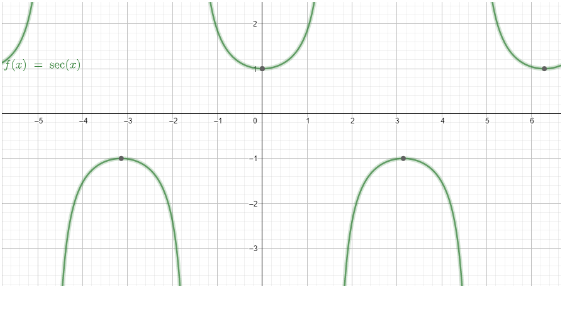
The usual common graph which is easier to plot on the graph is y=secx.
The graph is an oscillating graph with boundary being (−∞,−1) and (1,∞).
The domain for the graph y=secx is R.
The range for the graph y=secx is R\(−1,1).
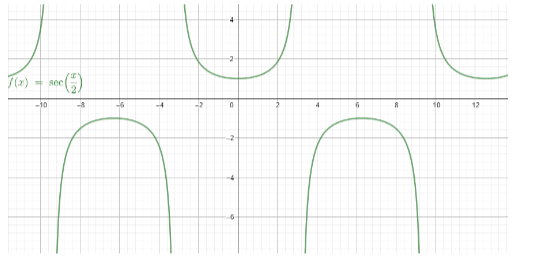
Now depending on the above-mentioned graph, we are going to first find the graph of
y=sec(2x).
The change between y=secx and y=sec(2x) is that the graph is now stretched for twice its previous area.
The domain for the graph y=sec(2x) is R.
The range for the graph y=sec(2x) is R\(−1,1).
Note: Amplitude is the vertical distance from the X-axis to the highest (or lowest) point on a sin or cosine curve. Period of each generalized sine or cosine curve is the length of one complete cycle. The previous graphs were oscillating for an area of π and now it’s for 2π.