Question
Question: How do you graph \[y = mx + b\]?...
How do you graph y=mx+b?
Solution
Hint : To graph the equation of a line in slope-intercept y=mx+b form, solve the equation for y then determine the slope and y-intercept of the line. Plot the y-intercept of the graph then start at the y-intercept and use the slope to count steps to another point on the graph. Then connect the two points.
Complete step-by-step answer :
Given,
y=mx+b
In the equation y=mx+b is for a straight line, m is called the slope of the line, x is the x-coordinate of a line and y is y-coordinate of a line. The number b is called the y-intercept of the line.
To graph the equation of a line written in slope-intercept y=mx+b form, start by plotting the y-intercept, which is the b value. The y-intercept is where the line will cross the y-axis, from the y-intercept point, use the slope to find a second point. The numerator of the slope tells you how many units to move up or down from the intercept, and the denominator of the slope tells you how many units to move left or right in order to plot the second point. Connect the two points and draw arrows at either end to indicate that the line extends infinitely.
To graph a linear equation in slope-intercept form, we can use the information given by that form. For example,
y=2x+3
This tells us that the slope of the line is 2 and the y-intercept is at (0,3). This gives us one point the line goes through, and the direction we should continue from that point to draw the entire line.
Graphing the equation y=mx+b as:
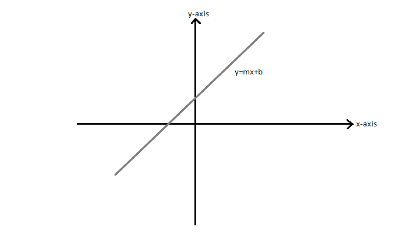
Note : Slope-intercept form, y=mx+b, of linear equations, emphasizes the slope and the y-intercept of the line. The slope of a line characterizes the direction of a line. To find the slope, you divide the difference of the y-coordinates of two points on a line by the difference of the x-coordinates of those same two points.