Question
Question: How do you graph \(y = {\log _4}(x + 1)\)?...
How do you graph y=log4(x+1)?
Solution
To solve this question, we need to follow some certain steps. First, we need to find asymptotes for the given functions. After that we will find the y-intercept of the graph which is the point at which the value of x will be zero. Finally we will find another two points by using two different values of x which will help us to plot the graph.
Complete step by step solution:
We are given the function y=log4(x+1).
First, we will find the asymptotes of the function. This means that we need to find where the given function cannot be defined.
We know that the logarithm of the number exists only if the number is greater than zero.
Therefore, for the given function y=log4(x+1), we can say that the function cannot be defined for the values of x less than or equal to −1 which is x⩽−1.
Therefore, for vertical asymptotes for the given function is x=−1.
Now, we will find the y-intercept of the graph. This can be done by putting the value of x as zero.
y=log4(x+1)
We will now put x=0.
⇒y=log4(0+1)=log41=0
Therefore, the y-intercept of the function is (0,0).
Now, let us find the point where x=1.
y=log4(x+1)
We will now put x=1.
⇒y=log4(1+1)=log42=log4(4)21=21log44=21=0.5
Therefore, we get a point (1,0.5)on the graph.
Now, let us find the point where x=3.
⇒y=log4(3+1)=log44=1
Thus, we get another point (3,1) on the graph.
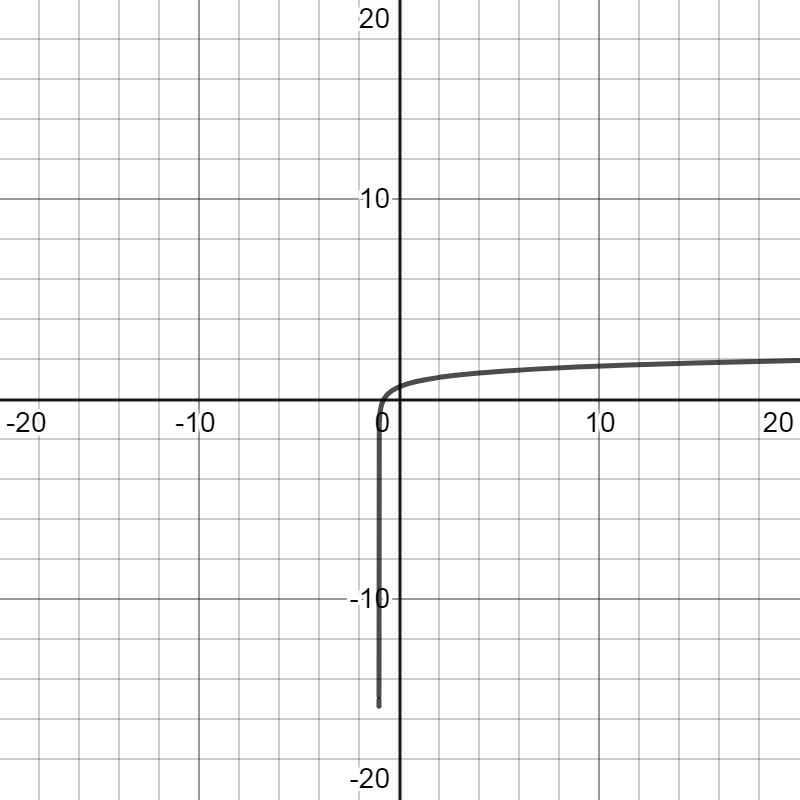
Now we have three points (0,0), (1,0.5)and (3,1) and the vertical asymptotes x=−1. By using this information, we can get the graph of the function y=log4(x+1) as:
Note: Here, we have taken the values of x to obtain the points (1,0.5)and (3,1) such that they are in the relation with the base. As a result we have used two important properties of logarithm. First the exponent rule, logamn=nlogam and second logaa=1.