Question
Question: How do you graph \(y = \ln (x + 3)\) ?...
How do you graph y=ln(x+3) ?
Solution
To draw this graph y=ln(x+3) at first, we have to know about the graph y=lnx . Then we have to see the point of intersection of y=lnx with x -axis. Then we have to shift this point three times left of the x axis and find out the point of intersection with the y -axis, then our work will be easy.
Complete step-by-step solution:
First, we have to draw the graph y=lnx .
For that, we have to take some values of x coordinate and find out the values of y .
Let us take the values 0 , 1 , e ( a specific number lies between 2 and 3 ; the value is approximate to 2.718 ), 2 and 5 of x .
Now we will find the values of y-axis for these values.
At x=0 ;
From the equation y=lnx we will get;
y=ln0
⇒y=∞
At x=1 ;
From the equation y=lnx we will get;
y=ln1
⇒y=0
At x=e ;
From the equation y=lnx we will get;
y=lne
We know that lne=1 .
⇒y=1
At x=2 ;
From the equation y=lnx we will get;
y=ln2
⇒y=0.693
At x=5 ;
From the equation y=lnx we will get;
y=ln5
⇒y=1.609
Now we will plot these points (0,∞) , (1,0) , (e,1) , (2,0.693) and (5,1.609) in the two-dimensional coordinate system and we will get the graph of y=lnx .
To draw y=ln(x+3) we just have to shift each point in the x axis and then we can easily get the values of y -axis. We will get the points (−3,∞) , (−2,0) , (e−3,1) , (−1,0.693) and (2,1.609) .
Now we will put these points and finally get;
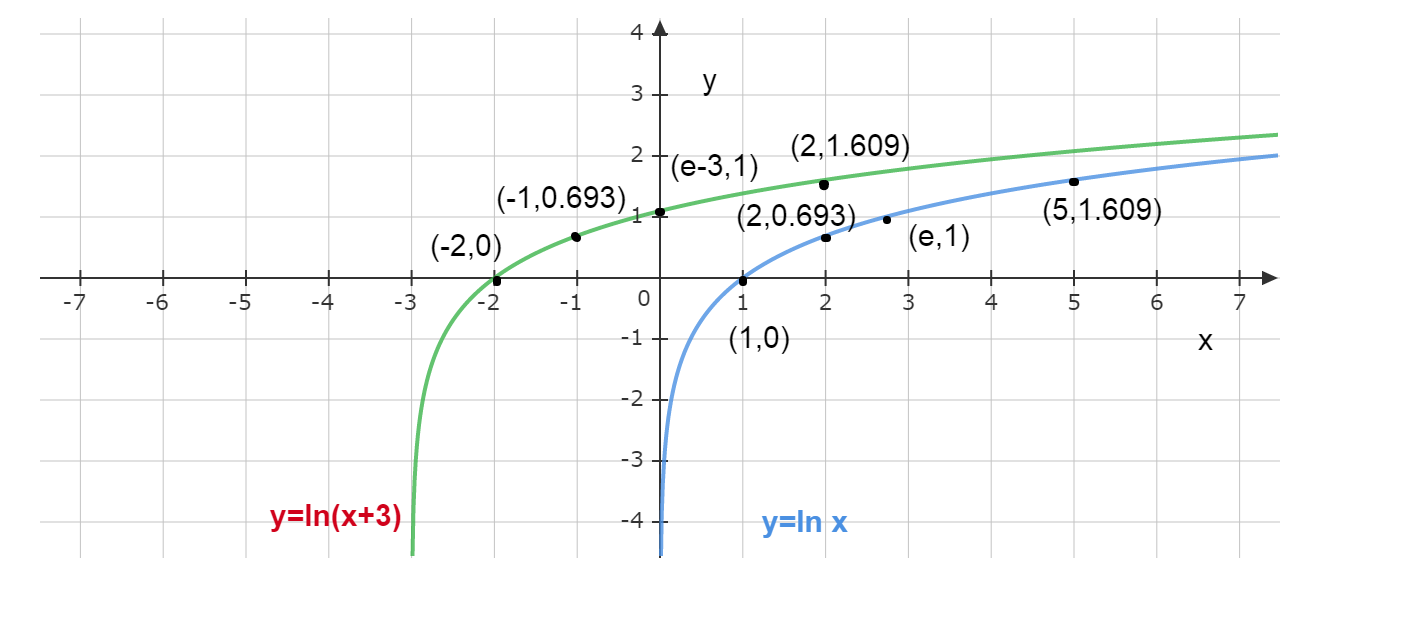
Here clearly (0,∞) and (−3,∞) give the lower part of the graphs.
Note: Whenever we have this kind of plotting question at first we will try to find the nearest known function. Students should always be careful that (0,∞) and (−3,∞) can’t be plotted. They only imply that the value of x the graph will tend to infinity which means a never-ending end of the value of y -axis.