Question
Question: How do you graph \(y = {\left( {x - 5} \right)^2}\)?...
How do you graph y=(x−5)2?
Solution
First, find the x-intercepts of the curve by putting y=0. After that, find the y-intercept by putting x=0. Then take a minimum of 5 points and plot the points. After plotting the points, join the points with a smooth freehand curve and identify the curve that we have obtained.
Complete step-by-step answer:
We know that the graph of a function is the locus of points (x,y) such that y=f(x) where x, y are real numbers. We are given the following quadratic polynomial function,
⇒y=(x−5)2
So, let us put y=0 and find the x-intercept. We have,
⇒0=(x−5)2
Take the square root on both sides,
⇒x−5=0
Add 5 on both sides,
⇒x−5+5=0+5
Simplify the terms,
⇒x=5
It means the curve cuts the x-axis at (5,0).
Let us put x=0 and find the y-intercept. We have,
⇒y=(0−5)2
Simplify the terms,
⇒y=(−5)2
Square the term on the right side,
⇒y=25
It means the curve cuts the y-axis at (0,25).
We know that all quadratic functions of the type y=ax2+bc+c have minimum values but not maximum.
Since the square is always non-negative, we have (x−5)2≥0, then we have
⇒y=(x−5)2≥0
So, the minimum value of y=0 and the minimum value occurs when (x−5)2=0 or x=5.
We already have two points for the curve (5,0) and (0,25). We find y for three more points.
At x=9 we have,
⇒y=(9−5)2
Simplify the terms,
⇒y=(4)2
Square the term on the right side,
⇒y=16
At x=3 we have,
⇒y=(3−5)2
Simplify the terms,
⇒y=(−2)2
Square the term on the right side,
⇒y=4
At x=7 we have,
⇒y=(7−5)2
Simplify the terms,
⇒y=(2)2
Square the term on the right side,
⇒y=4
So, we draw the table for x and y.
| x | 0 | 5 | 1 | 3 | 7 |
|---|---|---|---|---|---|
| y | 25 | 0 | 16 | 4 | 4 |
We plot the above points and join them to have the graph as
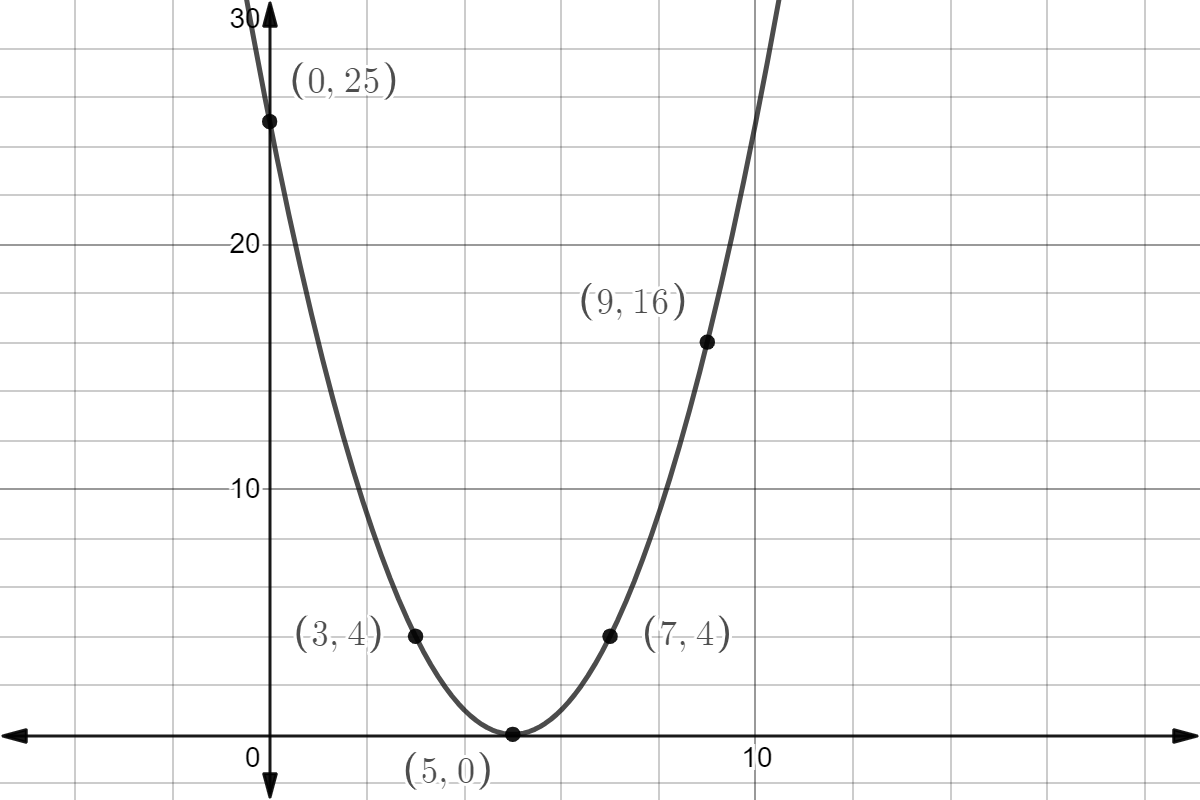
Note:
We note that the obtained graph is the graph of the upward parabola whose general equation is given by y=ax2+bx+c with the condition a>0 whose vertex here is (5,0) . We can directly find the minimum value of y=(x−5)2 by finding x=−2ab. If a<0 the equation y=ax2+bx+c represents a downward parabola. We also note that the obtained curve is symmetric about the line x=5.