Question
Question: How do you graph \(y=\left| x-2 \right|\) ?...
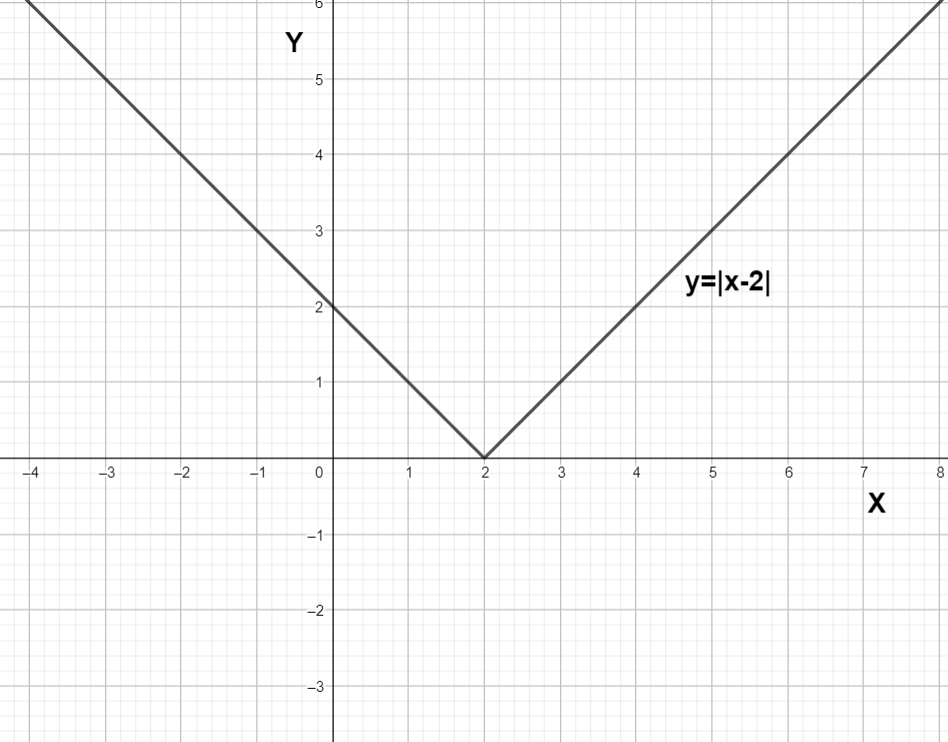
How do you graph y=∣x−2∣ ?
Solution
First we will draw the graph of y=x . if we know the graph of f(x) we can draw the graph of f(∣x∣) call it g(x) then we can draw g(x−2) which is f(∣x−2∣) by shifting the graph 2 units towards right.
Complete step by step answer:
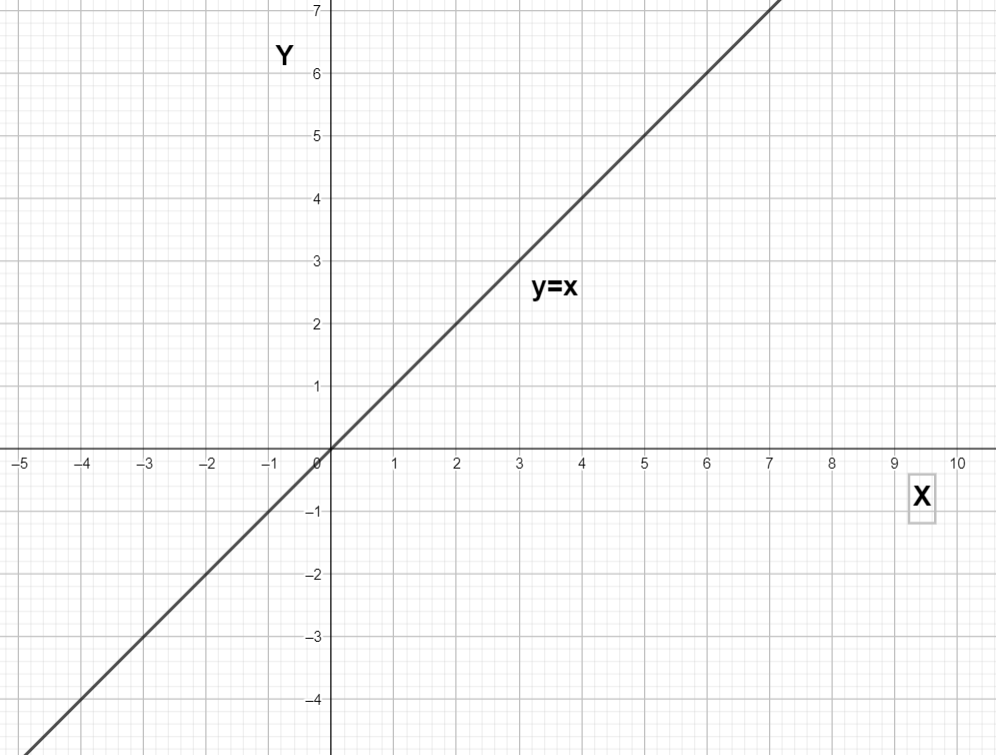
To draw the graph of y=∣x−2∣ lets draw the graph of y=x. The graph of y=x is straight line passing through origin with slope 1.
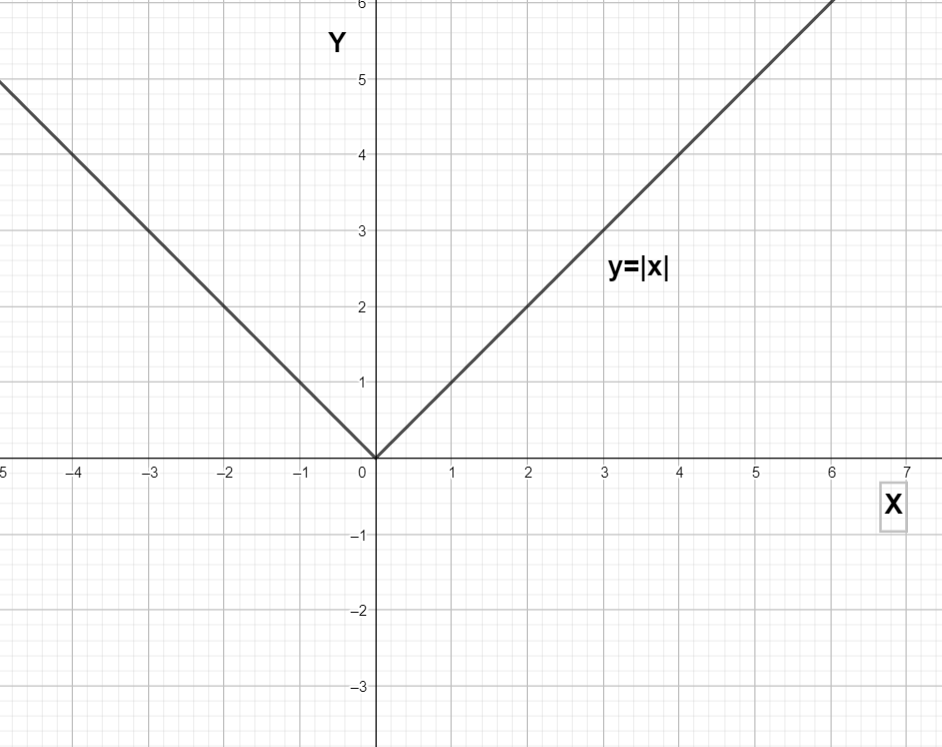
If we y=f(x) then f(∣x∣) will be y=∣x∣ . The graph of f(∣x∣) is same as y=f(x) when x is greater than 0 and the graph of f(∣x∣) is symmetric about Y axis. Basically f(∣x∣) is f(x) when x is greater than 0 and f(−x) when x is less than 0.
So let’s draw the graph of y=∣x∣
Let take g(x) as ∣x∣ then g(x−2) will be ∣x−2∣ . We know that if to draw graph of g(x−2) we need to shift the graph of g(x) 2 units toward right.
So if we shift the graph of ∣x∣ 2 units towards right we will get the graph of ∣x−2∣
So let’s do that

The above graph is the graph of y=∣x−2∣ .
Note: We draw the graph by write the definition of y=∣x−2∣ .
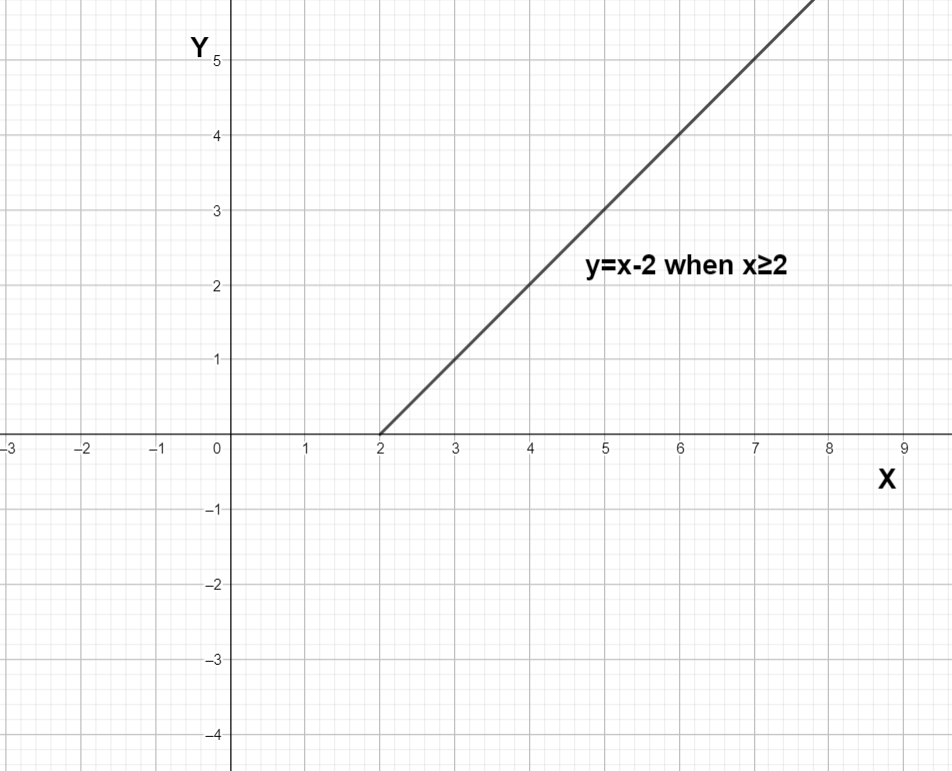
∣x−2∣ = x−2 when x is greater equal to than 2
= 2−x when x is less than equal to 2
we can draw graph of x−2 when x is greater than or equal to 2
We can draw the graph of 2−x when x is less than or equal to 2
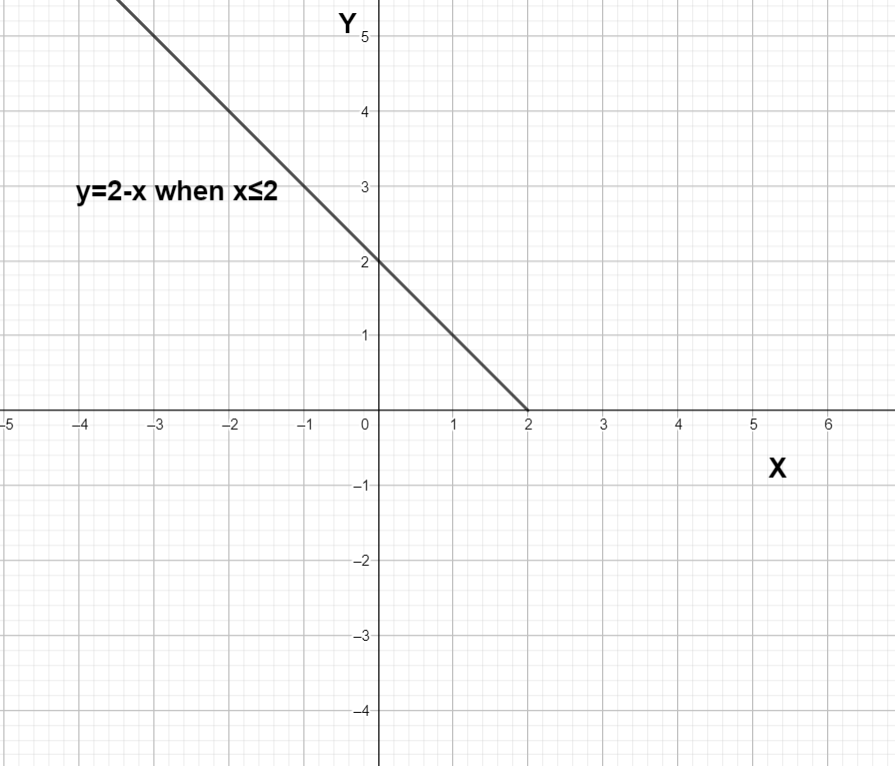
Merging 2 graphs