Question
Question: How do you graph \[y = \left| {x - 1} \right|\]?...
How do you graph y=∣x−1∣?
Solution
Here we need to find the graph of the given absolute value functions. To graph the absolute value function, we will substitute different values of variable x in the function to get corresponding values of y. From there, we will get the points that lie on the graph. Using the values, we will draw the graph by marking the points obtained.
Complete step by step solution:
Here we need to find the graph of the given absolute value functions. The given absolute value function is y=∣x−1∣.
We know that the absolute value function is defined as that contains an algebraic expression within absolute value symbol ∣∣.
The −1 in the absolute bars means the graph is going to shift one to the right.
To graph an absolute value function, we will choose several values of x and find some ordered pairs.
We will substitute random values of x, from there, we will find the value of y.
x| x−1| y=∣x−1∣
---|---|---
−2| −3| 3
−1| −2| 2
0| −1| 1
1| 0| 0
2| 1| 1
Now, we will use these points to draw the graph.
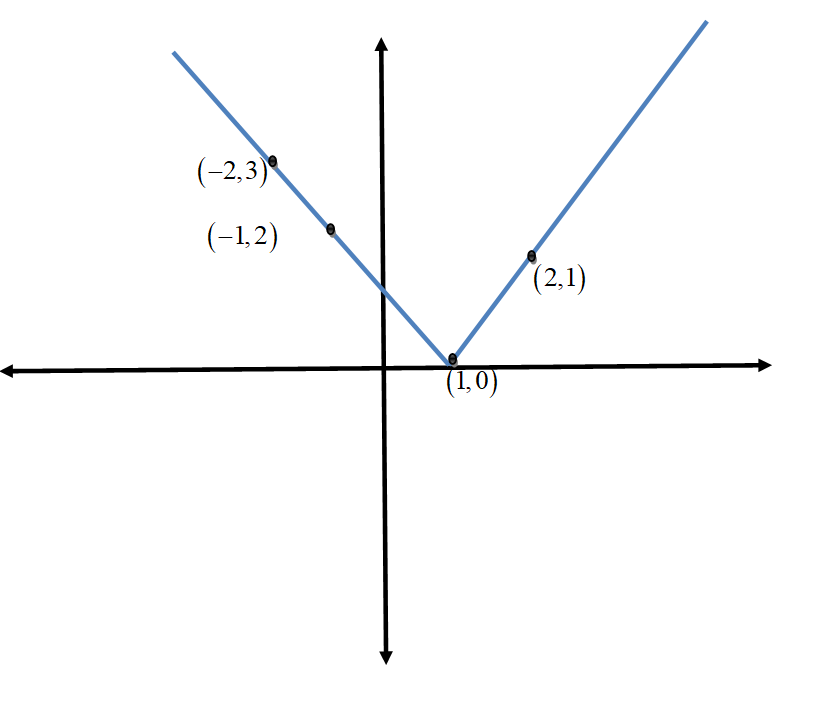
Hence, this is the required graph of the given absolute function.
Note:
Here we have obtained the graph of the given absolute value function. We know that the absolute function is defined as that contains an algebraic expression within the absolute value symbol. We need to keep in mind that the absolute value of a number is its distance from 0 on the number line. We know the absolute value of any real number is always positive, so the graph of an absolute value function will lie on the positive side only.