Question
Question: How do you graph \[y=-{{\left( \dfrac{1}{5} \right)}^{x}}\] and state the domain and range?...
How do you graph y=−(51)x and state the domain and range?
Solution
In the given question, we have been asked to plot the graph for exponential function and finding the domain and the range. Exponential functions are those functions in which the variable of a given function is present in exponent. Domains of a function are the set of all the values where the function is defined and the range of a given function are all the values of ‘y’ that corresponds with the domain.
Complete step by step solution:
We have given that,
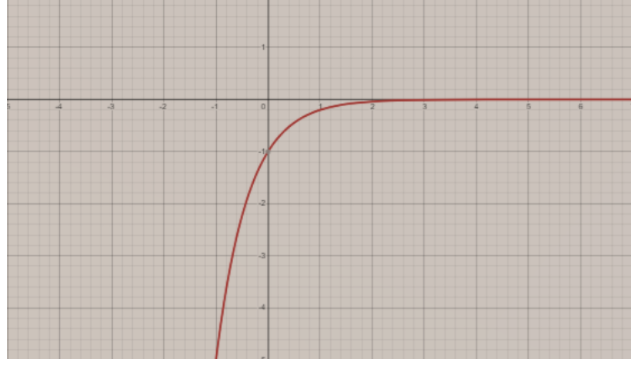
y=−(51)x
By considering the necessary condition,
We know that, y=−(51)x< 0 and y=−(51)x= 0 when x→∞.
Now, finding the y-intercept;
Taking x = 0
We have,
y=−(51)x
y=−(51)0
⇒y=−1
(A zero power to any constant is always equal to 1.)
Thus,
We got a point i.e. (0, -1).
Now, finding the x-intercept;
Taking y = 0
We have,
y=−(51)x
0=−(51)x
⇒x=−∞
Thus,
We got a point i.e.(−∞,0).
For plotting the graph,
Exponential functions have a horizontal asymptote i.e. the equation of the horizontal asymptote is represented as y = 0.
Now,
Domain of the given function is where the equation is defined, i.e.
Domain: \left( -\infty ,\infty \right),\left\\{ x\left| x\in \mathbb{R} \right. \right\\}
Range of the given function is the set of values that correspond with domain, i.e.
Range: \left( -\infty ,0 \right),\left\\{ y\left| y<0 \right. \right\\}
Hence, this is the required answer.
Note:
While solving these types of questions, students always need to remember that we need to first find the domain and the range of the given exponential function and exponential graphs are always decreasing when the base of the given exponential function is greater than zero and less than 1 whereas they are always increasing if base of the given exponential is greater than 1.