Question
Question: How do you graph \(y = {\left( {\dfrac{1}{5}} \right)^x}\) ?...
How do you graph y=(51)x ?
Solution
In this question, we are given an equation and we have to plot that equation on the graph. So, I suggest you find the intercepts first and plot those points on the graph. To find the intercepts, first, put x=0, and then put y=0. This will give you two points and then, you can plot them on the graph. After plotting the points, just connect the two points with a free hand and you will get the curve.
Complete step by step answer:
We are given an equation and we have to plot that equation on the graph. So, we will start by finding the points.
Point 1: We will put x=0 and then we will find its y coordinate.
⇒y=(51)x
Puttingx=0, we will get –
⇒y=(51)0=1 (Any number raised to the power 0 is 1.)
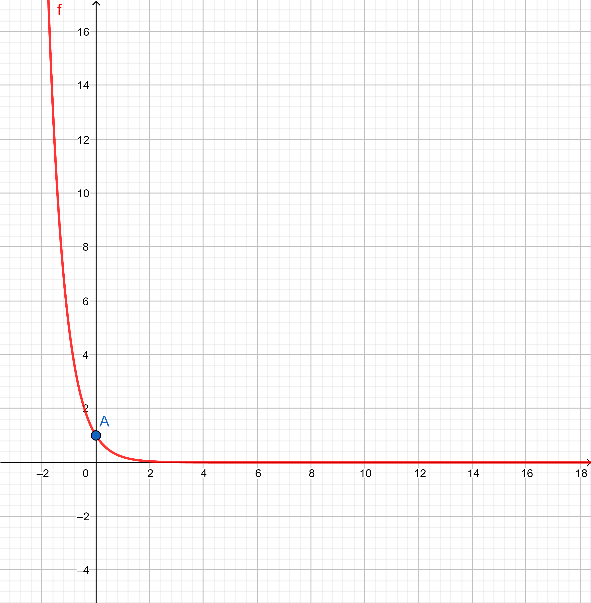
Therefore, our point is (0,1). Let us name this point as A.
Point 2: If we put y=0, it won’t give us any point as our curve does not exist at y=0.
So, what shall we do?
If we put x=∞, what will we get?
⇒y=(51)∞
This value is undefined or we take it as 0. This indicates that when x is moving towards ∞, the value of y becomes very small (smaller than 1 as y is equal to 1 at x=0). Thus, the graph will look like this –
Note: Infinity is not a number, it’s a concept. When a number or a limit becomes so large that it is not possible to write it down or when it becomes undefined, we call it infinity
Same goes with the negative of infinity. When a number becomes too small to be defined, we call it negative infinity (−∞).