Question
Question: How do you graph \(y=\left| 2x+3 \right|\)?...
How do you graph y=∣2x+3∣?
Solution
In this problem we need to draw the graph of the given equation y=∣2x+3∣. We can observe that the given equation is in modulus i.e., it will give only positive values of y from the both the equations y=2x+3, y=−2x−3. So, we will draw the graphs of the both the lines y=2x+3, y=−2x−3 and we will consider only positive part of the both lines to show the graph of y=∣2x+3∣. To draw the graphs of the lines y=2x+3, y=−2x−3, we will first assume y=0 and calculates the value of x and mark the points (x1,0), (x2,0) on the graph paper. Now we will assume x=0 and calculates the value of y and mark the points (0,y1), (0,y2) on the graph paper. Now the line that joins the points (x1,0), (0,y1) will represent the line y=2x+3 and the line that joins the points (x2,0), (0,y2) will represent the line y=−2x−3. After plotting the graphs of the lines y=2x+3, y=−2x−3 we will eliminate the part of the graphs which is in negative of y to show the graph of y=∣2x+3∣.
Complete step-by-step solution:
Given equation, y=∣2x+3∣.
We can write the equation y=2x+3, y=−2x−3 from the above given equation.
Substituting y=0 in the both equation and simplifying them, then we will get
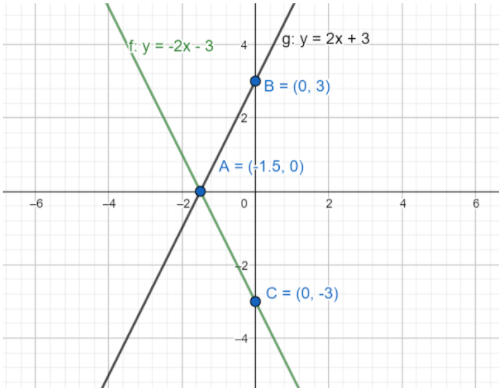
0=2x+3⇒−3=2x⇒x=−1.5 and 0=−2x−3⇒2x=−3⇒x=−1.5
Now the point (−1.5,0) lies on both the equations.
Substituting x=0 in the both equation and simplifying them, then we will get
y=2(0)+3⇒y=3 and y=−2(0)−3⇒y=−3
So, the point (0,3) lies on y=2x+3, the point (0,−3) lies on the line y=−2x−3.
Plotting the points on a graph paper and joining (−1.5,0), (0,3) to get the line y=2x+3 as well as joining the points (−1.5,0), (0,−3) to get the line y=−2x−3.
Now eliminating or neglecting the part of the graph which in negative y to get the graph of y=∣2x+3∣.
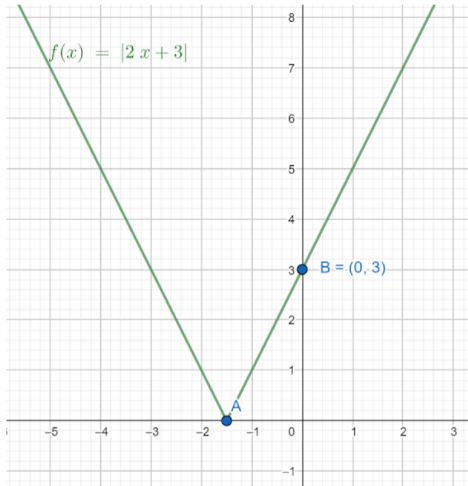
The above graph is our required graph.
Note: In the problem we have the equation like y=∣2x+3∣, so we have followed the above method. Instead of giving y=∣2x+3∣ if they have given y=2x+3 or y=−2x−3, then we will calculate the values of x and y when the other variables are zero and join those points to get the graph.