Question
Question: How do you graph \(y = \dfrac{8}{3}x - 3\)?...
How do you graph y=38x−3?
Solution
First of all this is a very simple and a very easy problem. The general equation of a straight line is y=mx+c, where m is the gradient and y=c is the value where the line cuts the y-axis. The number c is called the intercept on the y-axis. Based on this provided information we try to find the graph of the given straight line.
Complete step by step answer: Consider the given linear equation, as given below:
⇒y=38x−3
Now the given straight line is already in the standard form of the general equation of a straight line.
The slope of the straight line y=38x−3, on comparing with the straight line y=mx+c,
Here the slope is m, and here on comparing the coefficients of x, as shown below:
⇒m=38
So the slope of the given straight liney=38x−3 is 38.
Now finding the intercept of the line y=38x−3, on comparing with the straight line y=mx+c, Here the intercept is c, and here on comparing the constants of the straight lines,
⇒c=−3
So the intercept of the given straight liney=38x−3 is -3.
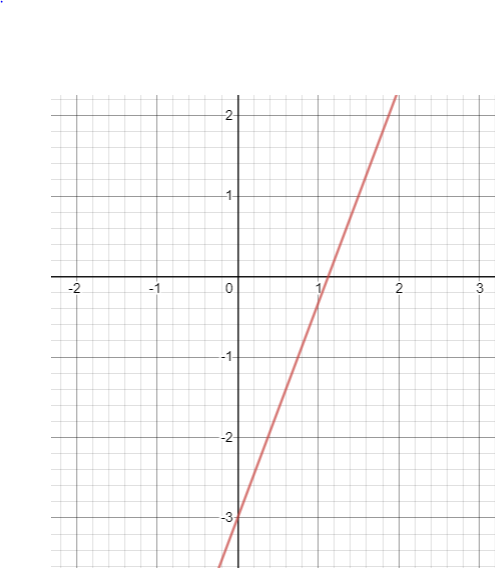
Now plotting the straight line with slope 38 and a y-intercept of -3, as shown below, here the y-intercept is negative, whereas the slope is positive.
Note:
Please note that while solving such kind of problems, we should understand that if the y-intercept value is zero, then the straight line is passing through the origin, which is in the equation of y=mx+c, if c=0, then the equation becomes y=mx, and this line passes through the origin, whether the slope is positive or negative.