Question
Question: How do you graph \[y=-\dfrac{5}{2}x-3\] using the slope and intercept?...
How do you graph y=−25x−3 using the slope and intercept?
Solution
To solve this question we must know the equation of a straight line in slope-intercept form. The equation of form y=mx+c is called a slope-intercept form of a straight line, here m is the slope of the line, and c is the Y-intercept of the straight line. In other words, the line is inclined at an angle of tan−1(m) to the positive direction of the X-axis and passed through the point (0,c). We can graph the straight line using this information.
Complete step by step answer:
We are given the equation y=−25x−3, we need to graph it using the slope and intercept form. First, we should convert the equation to the slope equation form of the equation which is of the form y=mx+c, here m is the slope of the line, and c is the Y-intercept of the straight line. To convert to this form, only the variable y should be on one side of the equation, and all other terms to the other side. As we can see, the given equation y=−25x−3 satisfies this condition. So, this is already given in the slope-intercept form. Comparing with y=mx+c, we get slope of line =m=−25, and Y-intercept as (0,c)=(0,−3).
Using the slope and Y-intercept we can plot the graph of a straight line as,
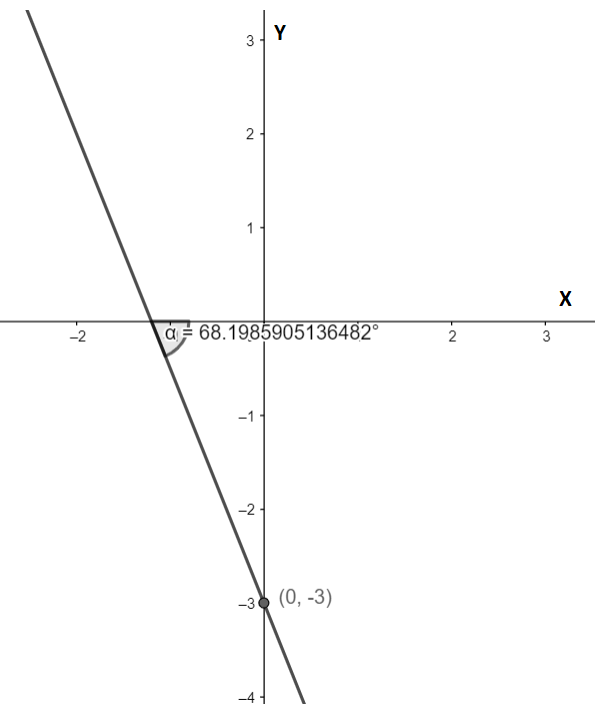
Note: We can also plot the equation of the straight line using other forms also, for example, intercept form, standard form, etc. Also, it should be noted that the angle we get from tan−1(m), should always be an anticlockwise angle measured from the positive direction of the angle to the line. Hence the angle that the line makes in this case is 180∘−α, α is shown in the figure.