Question
Question: How do you graph \[y = \dfrac{3}{2}x - 4\] using slope and intercept?...
How do you graph y=23x−4 using slope and intercept?
Solution
Hint : Here in this question, we have to plot the graph for the equation using the slope and the intercept. By substituting the x is equal to zero we can find the y intercept value and substituting y is equal to zero we can find the x intercept value. By equating the given equation to the general equation of line we can determine the slope.
Complete step-by-step answer :
The given equation is in the form of y=mx+b , where m is slope and b is known as y-intercept. Slope means ratio of vertical change to the horizontal change i.e., ratio of change in y-axis or step size of y-axis to the change in x-axis or step size of x-axis. An intercept is a point where the straight line or a curve intersects the y-axis in a plane. If the point x is zero then the obtained point is a y -intercept.
Now consider the given equation y=23x−4 -----------(1)
Substitute the value of x as 0 in equation (1), then we have
⇒y=23(0)−4
On simplifying we get
⇒y=−4
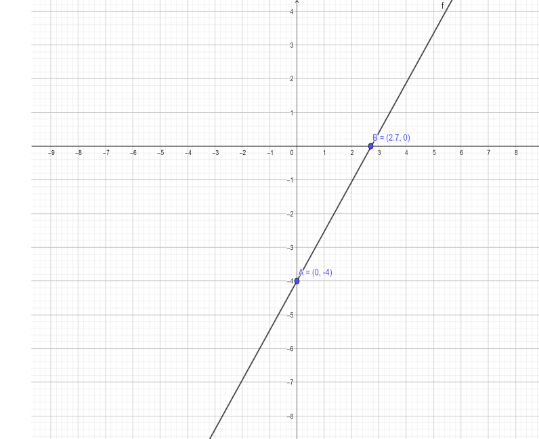
Therefore, y-intercept is (0,-4)
Substitute the value of y as 0 in the equation (1) then we have
⇒0=23x−4
On simplifying we get
We round of the number and write as x=2.7
Therefore, x-intercept is (2.7, 0)
The general equation of a line is given by y=mx+b , the b is the y-intercept and it is -4. On substituting we get y=mx−4 ------ (2)
On comparing the equation (1) and equation (2) we get
m=23
Therefore, the slope is 23
The graph for this is given below
Note : The question belongs to the concept of graph. By comparing the given equation to the equation of a line we calculate the slope and intercept. Or by choosing the value of x we can determine the value of y and then plotting the graphs for these points we obtain the result.