Question
Question: How do you graph \(y=-\dfrac{2}{3}x+1\) ?...
How do you graph y=−32x+1 ?
Solution
Here we need to find the graph for the given equation and we know that this is an equation of a straight line and the given equation is written in the slope-intercept form. So from there, we will get the value of the slope of the line and then the y intercept. Then we will find the value of the x intercepts by putting the value of y as zero. Then using the slope and the intercepts, we will draw the graph accordingly.
Complete step by step solution:
Here we need to find the graph for the given equation and the given equation is y=−32x+1.
We know that this is an equation of a straight line and the given equation is written in the slope-intercept form.
We know that the slope-intercept form of an equation is given by y=mx+b
Here, m is the slope of the line and b is the y intercept.
Now, we will compare this equation with the given equation.
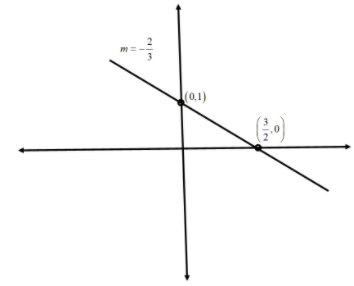
Slope in this case is 3−2 and y intercept is equal to 1.
Now, we will find the x intercepts by putting the value of y as zero.
0=−32x+1
Now, we will subtract 1 from both sides.
⇒0−1=−32x+1−1
On further simplification, we get
⇒−1=−32x
Now, we will divide both sides by 3−2
⇒−32−1=−32−32x
On further simplification, we get
⇒23=x ⇒x=23
Therefore, the x intercept is equal to 23.
Now, we will draw the graph using the slope and the intercepts.
Note:
Here we have obtained the value of the slope of the line using the slope-intercept form of the equation. The slope of a line is defined as the value which measures the steepness of the line or the inclination of the line with the x axis. We know that the graph of a linear equation is always a straight line whereas the graph of a quadratic equation is always a curve. We can draw the graph of an equation by using the different points which are obtained by substituting different values of x and y in the equation.