Question
Question: How do you graph \(y = \dfrac{1}{{{x^2} - x - 6}}\)?...
How do you graph y=x2−x−61?
Solution
In this question, we need to plot a graph of the given equation. Firstly, we will find out the intercepts of the graph by setting one of the variables is equal to zero and obtaining the other variable and vice versa. Then we find the asymptotes which are vertical and horizontal asymptotes and plot a graph for this. Then from the graph, we find the required parabola or hyperbola in different regions by setting values x. Then finally we sketch the required graph for the given expression.
Complete step-by-step solution:
Given an equation of the form y=x2−x−61 …… (1)
We are asked to plot the graph of the expression given in the equation (1).
We cannot plot a graph of this expression directly.
To sketch the graph for this expression, we need to find out the intercepts and the asymptotes.
Firstly, we will find the intercepts of the equation (1).
Finding the y-intercept :
To find this, we set the value for x equal to zero. i.e. x=0 and solve for y.
Substituting x=0 in the equation (1), we get,
⇒y=02−0−61
⇒y=−61
Thus, the y-intercept is at (0,6−1).
Finding the x-intercept :
To find this, we set the value for y equal to zero. i.e. y=0 and solve for x.
Substituting y=0 in the equation (1), we get,
⇒0=x2−x−61
Transferring the denominator value in the R.H.S. to the L.H.S. we get,
⇒(x2−x−6)(0)=1
⇒0=1
Which is not possible. Thus, there is no x-intercept.
Now we find the asymptotes of the equation (1).
Finding vertical asymptotes :
To find this, we set the denominator in the equation (1) to zero and solve for the variable x.
Taking x2−x−6=0
We know that the middle term −x can be written as, −x=−3x+2x
Hence we get,
⇒x2−3x+2x−6=0
Factor out common terms we get,
⇒x(x−3)+2(x−3)=0
⇒(x−3)(x+2)=0
⇒x−3=0 and x+2=0
⇒x=3 and x=−2
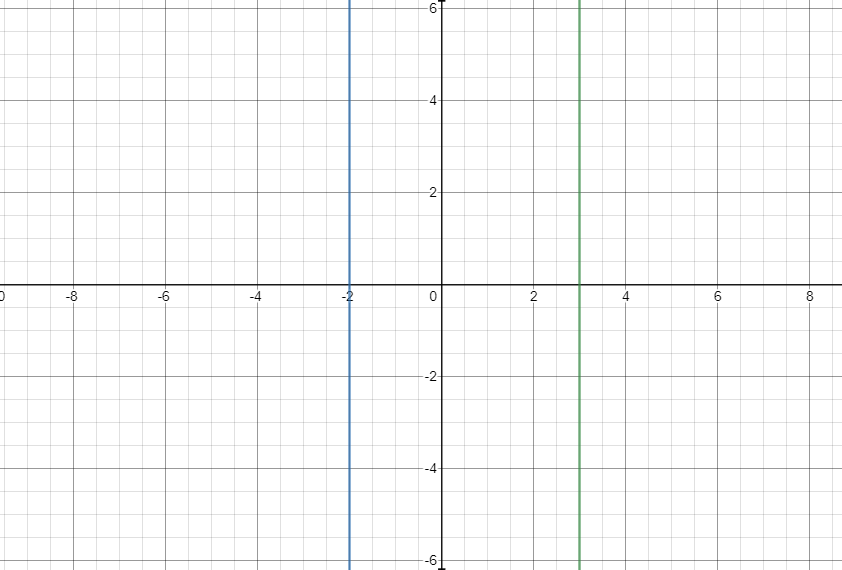
Hence, the vertical asymptotes at x=3 and x=−2.
Finding the horizontal asymptotes :
Since the degree of the numerator is less than the degree of the denominator, there are no particular horizontal asymptotes.
Hence the horizontal asymptotes is at y=0. i.e. the x-axis.
Now we draw the axes and the asymptotes obtained above.
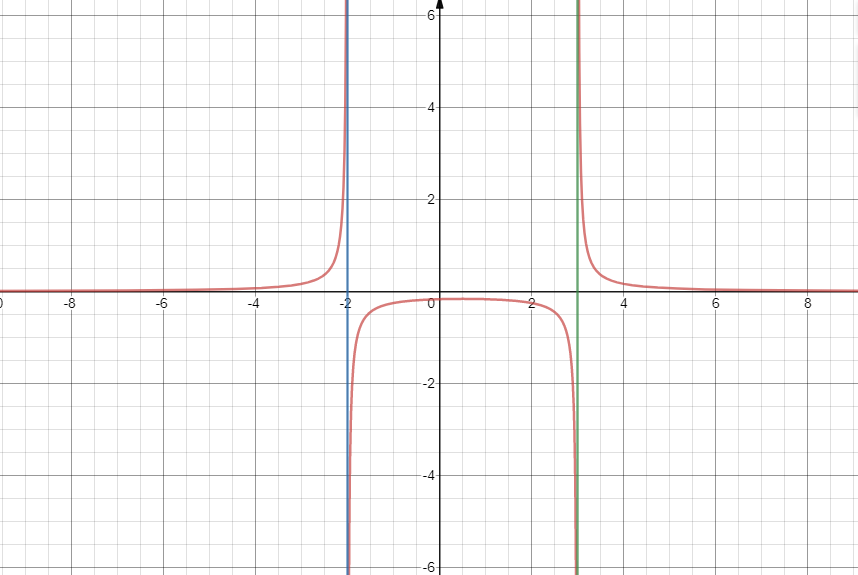
Now we sketch the graph in each region defined by the asymptotes.
(a) The left hand region : This region has the x-axis and the x=−2 as the asymptotes.
Now we substitute x=−3in the equation (1), we get,
⇒y=(−3)2−(−3)−61
⇒y=9+3−61
⇒y=61.
Note that the point (−3,61) is in the second quadrant. Hence, we have a hyperbola above the horizontal asymptote.
(b) The right hand region : This region has x=3 and the x-axis as asymptotes.
Now we substitute x=4 in the equation (1), we get,
⇒y=(4)2−(4)−61
⇒y=16−4−61
⇒y=61.
Note that the point (4,61) is in the first quadrant. Hence, we have a hyperbola above the horizontal asymptote.
Thus, we have a mirror image hyperbola in the first and second quadrant.
(c) The middle region : Let us consider different values of x.
For x=0, the equation (1) becomes,
⇒y=02−0−61
⇒y=−61.
For x=1, the equation (1) becomes,
⇒y=(1)2−1−61
⇒y=1−1−61
⇒y=−61.
For x=0.5, the equation (1) becomes,
⇒y=(0.5)2−0.5−61
⇒y=0.25−0.5−61
⇒y=−6.251.
Hence the points at (0,−61), (0.5,−6.251) and (1,−61) are all below the x-axis. Thus, we have an inverted parabola between the vertical asymptotes.
Note: Students may go wrong in plotting graphs for such expressions. They may just substitute different values of one variable say x and obtain the other variable. But this is an incomplete answer.
In such a problem we must first find out the x and y intercepts by setting one of the variables equal to zero. After that find the asymptotes which are vertical and horizontal.
Vertical asymptotes are found by setting the denominator equal to zero and for horizontal asymptotes, we compare the degree of numerator and denominator and find the answer.