Question
Question: How do you graph \[y = \dfrac{1}{5}x - 3\] by plotting points?...
How do you graph y=51x−3 by plotting points?
Solution
To graph an equation by plotting points, the easiest way to find points on the line of the given equation y=51x−3 is to convert the given equation in point slope form to slope intercept form: y=mx+b, where m is the slope, and b is the y-intercept. In order to do this, solve the point slope equation for y, then consider any x values to graph the solution.
Complete step by step solution:
Let us write the given linear equation:
y=51x−3
To graph the equation by plotting points, we need to create a table of values that satisfies the given equation:
f(x)=x,
f(x)=(51)⋅x,
f(x)=[(51)⋅x]−3
for easy comprehension.
Examine the graph for y=f(x)=x.
| x | f(x)=x |
|---|---|
| -2 | -2 |
| -1 | -1 |
| 0 | 0 |
| 1 | 1 |
| 2 | 2 |
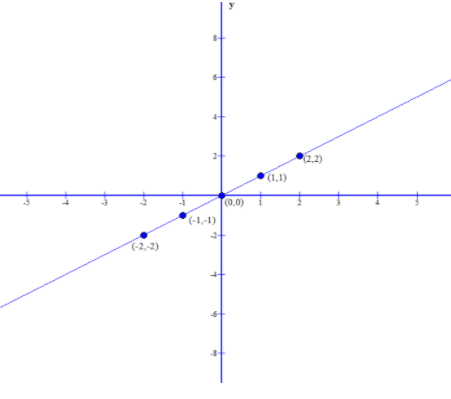
The graph obtained is Slope-Intercept form: y=mx+b,
where m is the slope, and b is the y-intercept.
This is of the form y=1⋅x+0, where Slope(m)=1 and y-intercept=0
Remember that the Slope(m) is the constant ratio that compares the change in y values over the change in x values between any two points. y-intercept is the coordinate point where the graph crosses the y-axis.
Now let us Examine the graph for f(x)=(51)⋅x
| x | 51x |
|---|---|
| -2 | -0.4 |
| -1 | -0.2 |
| 0 | 0 |
| 1 | 0.2 |
| 2 | 0.4 |
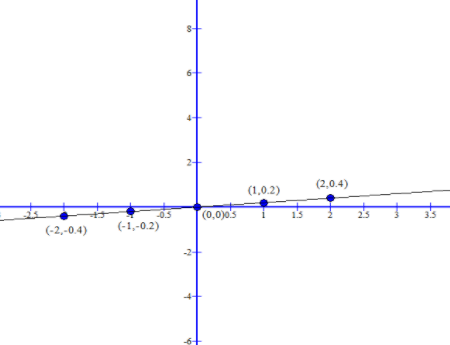
The graph obtained is Slope-Intercept form: y=mx+b,
In which,
Slope(m) = 51, and y-intercept is 0.
We need to create data table for x and corresponding y values:
y=f(x)=51x−3
| x | y |
|---|---|
| -5 | -4.00 |
| -4 | -3.80 |
| -3 | -3.60 |
| -2 | -3.40 |
| -1 | -3.20 |
| 0 | -3.00 |
| 1 | -2.80 |
| 2 | -2.60 |
| 3 | -2.40 |
| 4 | -2.20 |
| 5 | -2.00 |
Now construct the graph using these data values.
Examine the graph of y=f(x)=51x−3 as:
| x | 51x−3 |
|---|---|
| -2 | -3.4 |
| -1 | -3.2 |
| 0 | -3 |
| 1 | -2.8 |
| 2 | -2.6 |
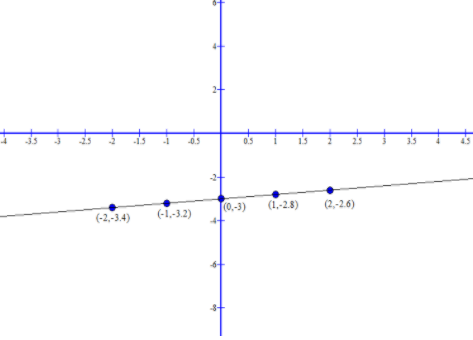
The equation is Slope-Intercept form: y=mx+b, and the slope obtained is:
Slope(m) = 51, and y-intercept is (0,−3).
Note:
In slope intercept form; very often, linear-equation word problems deal with changes over the course of time i.e., y=mx+b the number b is the coordinate on the y-axis where the graph crosses the y-axis and also, we can solve the given equation using intercept form i.e., when x = 0, the corresponding y-value is the y-intercept. In the particular context of word problems, the y-intercept (that is, the point when x = 0) also refers to the starting value.