Question
Question: How do you graph \(y=\dfrac{1}{4}x-4\) by plotting points? \[\]...
How do you graph y=41x−4 by plotting points? $$$$
Solution
We recall the three forms of writing a linear equation, the general formAx+By+C=0, the slope intercept form y=mx+c .We recall that we need points to plot a line. We find the first point as the intercepted point at x=0 and we take any other value of x to get the other point. $$$$
Complete step-by-step solution:
We know from the Cartesian coordinate system that every linear equation Ax+By+C=0can be represented as a line. If the line is inclined with positive x−axis at an angle θ then its slope is given by m=tanθ and if it cuts y−axis at a point (0,c) from the origin the y−intercept is given by c. The slope-intercept form of equation is given by
y=mx+c
We know that if m is positive then we get increasing from left to right and if m is negative we get a line decreasing from left to right. We are given in the following equation in the question,
y=41x−4
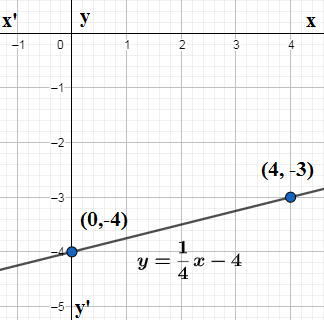
We see that the above equation is in slope-intercept form with slope m=41>0 and y−intercept c=−4 . So the given line increases from left to right and passes through the intercepts y−axis at (0,c)=(0,−4). We need another point to draw the line. Let us take x=4 and have;
y=41⋅4−4=1−4=−3
So the other point is (4,−3). We plot (0,−4),(4,−3) and join them with a line. $$$$
Note: We note to take x as multiple of 4 to find the second point for integral value of y.We can also take x−intercept y=0⇒x=16 to plot the other point. If the slope m=0 we get a line parallel to the x−axis and if the slope is undefined which means m=∞then we get a line perpendicular to x−axis.