Question
Question: How do you graph \(y = \dfrac{{ - 1}}{4}x\) ?...
How do you graph y=4−1x ?
Solution
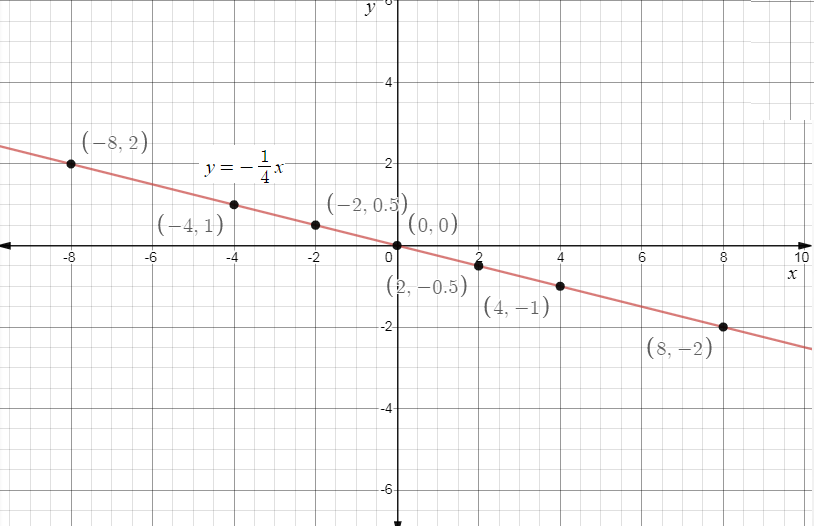
In this question we asked to find the graph of the given function, we will do this by plotting the points, for this we will give some values for x like 0, 1, 2, 3,…… simultaneously we will get the respective values for y, so after getting the values for x and y write the coordinates of the given equation in the form (x,y), then plotting the coordinates on the graph we will get the required graph.
Complete step by step solution:
Given function is y=4−1x, this is in the form of a linear equation with two variables.
Now take some values for x, as x=−8,
⇒y=4−1x,
Now substitute x=−8 in the above equation we get,
⇒ y=4−1(−8),
Now simplifying we get,
⇒y=2,
Now take x=−4,
⇒y=4−1x,
Now substitute x=−4 in the above equation we get
⇒ ⇒y=4−1(−4),
Now simplifying we get,
⇒y=1,
Now take x=−2,
⇒y=4−1x,
Now substitute x=−2in the above equation we get
⇒y=4−1(−2),
Now simplifying we get,
⇒y=21,
Now take x=0,
⇒y=4−1x,
Now substitute x=0 in the above equation we get
⇒y=4−1(0),
Now simplifying we get,
⇒y=0,
Now take x=2,
⇒y=−41x,
Now substitute x=2in the above equation we get
⇒ ⇒y=−41(2),
Now simplifying we get,
⇒y=−21,
Now take x=4,
⇒y=4−1x,
Now substitute x=4in the above equation we get
⇒y=4−1(4),
Now simplifying we get,
⇒y=−1,
Now take x=8,
⇒y=4−1x,
Now substitute x=8in the above equation we get
⇒y=4−1(8),
Now simplifying we get,
⇒y=−2,
Now tabulating the values we get,
| x | y |
|---|---|
| -8 | 2 |
| -4 | 1 |
| -2 | 21 |
| 0 | 0 |
| 2 | −21 |
| 4 | -1 |
| 8 | -2 |
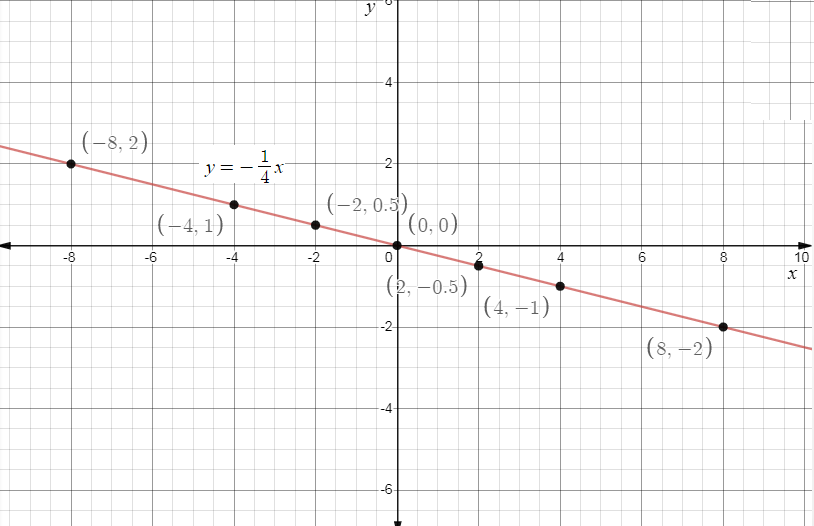
Now tabulate the values on the graph we get,

**Final Answer:
∴The graph of the given function y=4−1x will be equal to,

Note:**
We can represent every linear equation in two variables in a graph as a straight line in a coordinate plane. Points on the lines are known as the solution of the equation. So, the equation with one degree is known as linear equation. The expression of linear equations in a graph is known as graphing of linear equations in two variables.
