Question
Question: How do you graph \( y = \dfrac{1}{4} + \sin x \) ?...
How do you graph y=41+sinx ?
Solution
In this question, first we have to find the period and amplitude of the given function, and then take some values for x and then find y for each x , then tabulate the values and with help of the table we will get the required graph.
Complete step-by-step solution:
The graph of y=sinx is like a wave that forever oscillates between −1 and 1 , in a shape that repeats itself every 2π units. Specifically, this means that the domain of sinx is all real numbers, and the range is [−1,1] .
Properties of y=sinx :
The graph of the function y=sinx is continuous and extends on either side in symmetrical wave form.
Since the graph intersects the x-axis at the origin and at points where x is an even multiple of 90o , hence sinx is zero at x=nπ where n=0,±1,±2,±3......... .
The ordinate of any point on the graph always lies between 1 and - 1 i.e., −1<y<1 or, −1<sinx<1 hence, the maximum value of sinx is 1 and its minimum value is - 1 and these values occur alternately at 2π,23π,25π,.......... i. e., at x=(2n+1)2π where n=0,±1,±2,±3.........
Since the function y=sinx is periodic of period 2π , hence the portion of the graph between 0 to 2π is repeated over and over again on either side.
Now given function is y=41+sinx ,
Use the form y=asin(bx−c)+d to find the variables used to find the amplitude, period, phase shift, and vertical shift.
a=1 , b=1 , c=0 ,and d=41 ,
So here amplitude a=1 ,
Now period of the function is given by , ∣b∣2π from the given data,
Period of the given function will be 2π ,
Now select the points to graph then function,
When x=0 ,
⇒y=41+sin0 ,
Now simplifying we get,
⇒y=41+0=41 ,
When x=2π ,
⇒y=41+sin2π ,
Now simplifying we get,
⇒y=41+1=43 ,
When x=π ,
⇒y=41+sinπ ,
Now simplifying we get,
⇒y=41+0=41 ,
When x=23π ,
⇒y=41+sin23π ,
Now simplifying we get,
⇒y=41−1=4−3 ,
When x=2π ,
⇒y=41+sin2π ,
Now simplifying we get,
⇒y=41+0=41 ,
Now tabulating the values we get,
| X | y |
|---|---|
| 0 | 41 |
| 2π | 43 |
| π | 41 |
| 23π | 4−3 |
| 2π | 41 |
Now plotting the graphs we get,
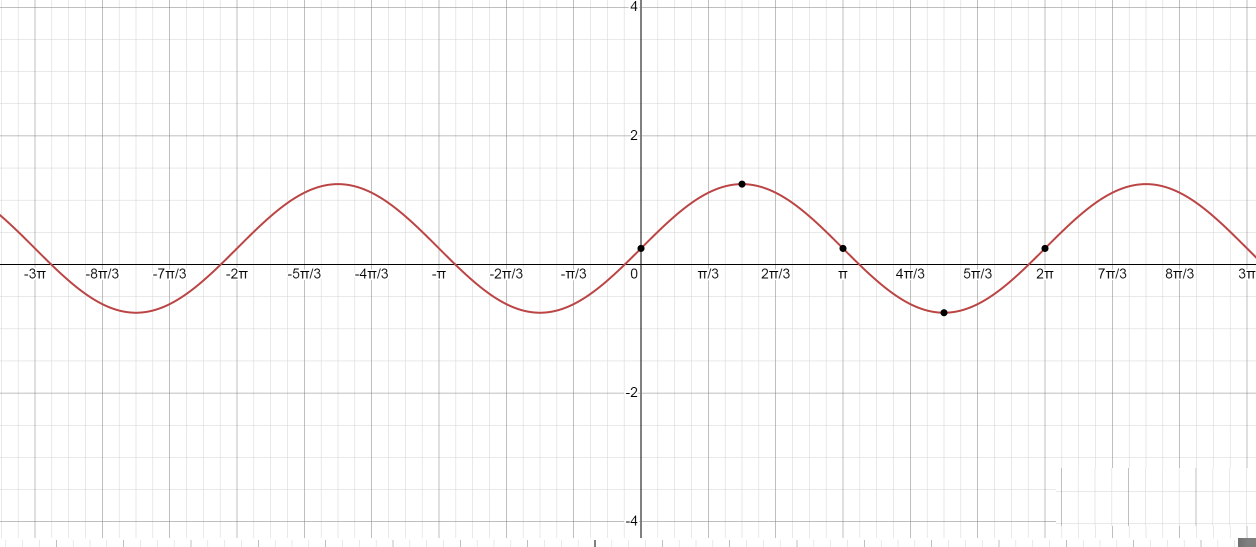
∴ The required graph for the function y=41+sinx is,

Note: When the sine of an angle is placed against the angle measure, the result will be classic “sine curve” shape. To draw the sine function, make the angle along the horizontal x -axis, and for every angle place the sin of that angle on the vertical y -axis, and the result will be a smooth curve.