Question
Question: How do you graph \(y = \dfrac{1}{3}x + 2\) by plotting points?...
How do you graph y=31x+2 by plotting points?
Solution
Here, in this question we are asked to graph the line y=31x+2. Before starting solving the question, we will have to compare it with slope-intercept form i.e., y=mx+c. Here, c=2 which means that the intercept on the y-axis is 2 and m=31 which means that the slope of the line is 31.
Complete step by step solution:
The given equation of the line isy=31x+2. We are supposed to put the equation in slope intercept form i.e.,y=mx+c. Here, we get y=31x+2, so we get m=31 and c=2. Now, we will have to make a table of values, which can be done by using different values of x.
Here, when we put x=3, we get y=3. So, we get point (3,3). When we put x=6, we get y=4. So, we get point(6,4).
| x | 3 | 6 |
|---|---|---|
| y | 3 | 4 |
| Point (x,y) | (3,3) | (6,4) |
So, now we have points: (3,3),(6,4).
Now, we draw our axes for x and y. We have to choose the appropriate scale and mark the values on the x and y axis. Mark all the three points and draw a straight line through these points.
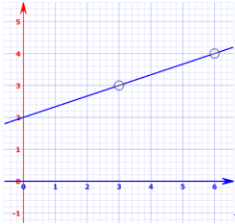
Therefore, we have our required graph.
Note: In order to solve such questions, we first need to analyse what is given to us. The given equation y=31x+2 is a simple linear equation. To graph a linear equation, we have to draw a line in a 2−D plane. Students should keep in mind that every linear equation represents a straight line. In order to check if the points calculated are correct or not, just put their values in the given equation if L.H.S=R.H.S then, the points are correct.