Question
Question: How do you graph \[y = \dfrac{1}{2}{x^2}?\]...
How do you graph y=21x2?
Solution
The given question describes the operation of using arithmetic operations like addition/ subtraction/ multiplication/ division. Also, this problem involves substituting the x in the given equation to find the value of y. Because y is the function of x . By using the values of xandy we can easily draw the graph for the given equation.
Complete step by step solution:
The given equation is shown below,
y=21x2
We would draw the graph for the above equation.
As a first step,
We would assume x value as given below,
x=.....−2,−1,0,1,2,....
By substituting the above-mentioned x values in the given equation we can find the y values.
The given equation is,
y = \dfrac{1}{2}{x^2}$$$$ \to \left( 1 \right)
Let’s substitute x=−2 in the equation(1)we get,
y=21x2
y=21(−2)2
So, we get
When x=−2 the value ofyis2.
Let’s substitutex=−1 in the equation(1)we get,
y=21x2
y=21(−1)2
So we get,
When x=−1 the value ofyis21.
Let’s substitute x=0 in the equation (1), we get
y=21x2
y=21(0)2
y=0
So we get,
When x=0 the value y is equal to0.
Let’s substitute x=1 in the equation (1), we get
y=21x2
y=21(1)2
y=21
So we get,
When x=1 the value yis equal to 21.
Let’s substitute x=2 in the equation (1) we get,
y=21x2
y=21(2)2
So we get,
When x=2 the value ofyis2.
| x | −2 | −1 | 0 | 1 | 2 |
|---|---|---|---|---|---|
| y | 2 | 21 | 0 | 21 | 2 |
Let’s make a tabular column by using the values of x and y.
By using this table we can easily draw the graph for the given equation.
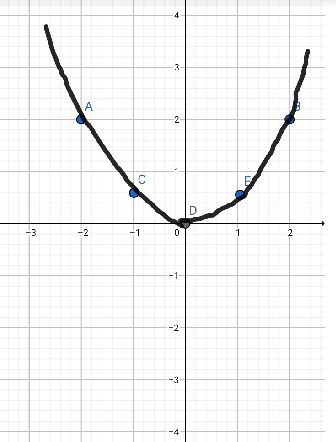
The above graph represents the equation y=21x2.
Note: This question describes the operation of addition/ subtraction/ multiplication/ division. Note that when the given equation is in the form of y=ax2 then the graph must be in parabolic shape.
Also, note that anything power zero will be one, and zero power anything will be one. When multiplying two different sign terms remember the following things,
- (−)×(−)=(+)
- (+)×(+)=(+)
- (−)×(+)=(−)