Question
Question: How do you graph \[y = - \dfrac{1}{2}\] using intercepts?...
How do you graph y=−21 using intercepts?
Solution
Linear equations in the form y=a have no x-intercept. The linear equation y=a is a line parallel to x-axis that intercept y-axis at point (0,a). Therefore, the graph is a line parallel to the x-axis that cuts the y-axis at negative of half for the given equation.
Complete step-by-step solution:
The given equation y=−21 can be written as shown below.
⇒y=−21+0x …… (1)
We are asked to draw the graph using the intercepts.
It is observed that a given equation is one of the equations of a straight line. We know this fact because both x and y terms in the equation are of power 1 (so they are not squared or square rooted terms).
We can simplify the given equation, so that our calculation becomes easier.
We find the points of intercepts and then draw a line through them as at least two points are needed to draw a unique line.
Finding the x-intercept:
The line crosses the x-axis at y=0.
Taking y=0 in the equation (1) we get,
⇒0=−21+0x
This can be written as,
⇒0=−21
This is a false equation. It implies that our substitution y=0 is not true.
This further implies that the line of a given equation does not have a x-intercept, in other word line is parallel to x-axis.
Finding the y-intercept:
The line crosses the y-axis at x=0.
Taking x=0 in the equation (1) we get,
⇒y=−21+0(0)
This can be written as,
⇒y=−21
So the point is (0,−21).
Hence the line does not have x-intercept and the y-intercept is (0,−21).
Now, we plot the graph on the x-y plane such that it cuts the y –axis at −21 and parallel to x-axis as shown in the below figure.
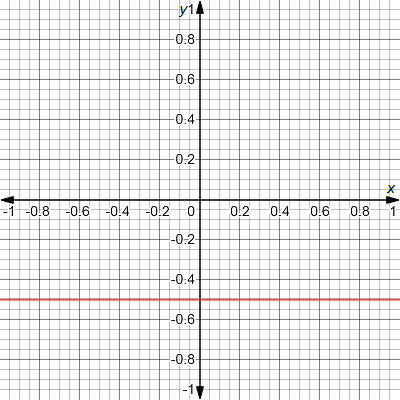
Note that the graph is a straight line parallel to x-axis.
Note: Students must remember that to obtain the x-intercept, we set the value of y equal to zero and find the point. Then, to obtain the y-intercept, we set the value of x equal to zero and find the point. Then from obtained (x,y) points we plot a graph of the given equation in the x-y plane.